. 2006 Mar;80(5):2106-17.
doi: 10.1128/JVI.80.5.2106-2117.2006.

Mouse-adapted scrapie infection of SN56 cells: greater efficiency with microsome-associated versus purified PrP-res

Affiliations

Mouse-adapted scrapie infection of SN56 cells: greater efficiency with microsome-associated versus purified PrP-res

Gerald S Baron et al. J Virol. 2006 Mar.

Abstract

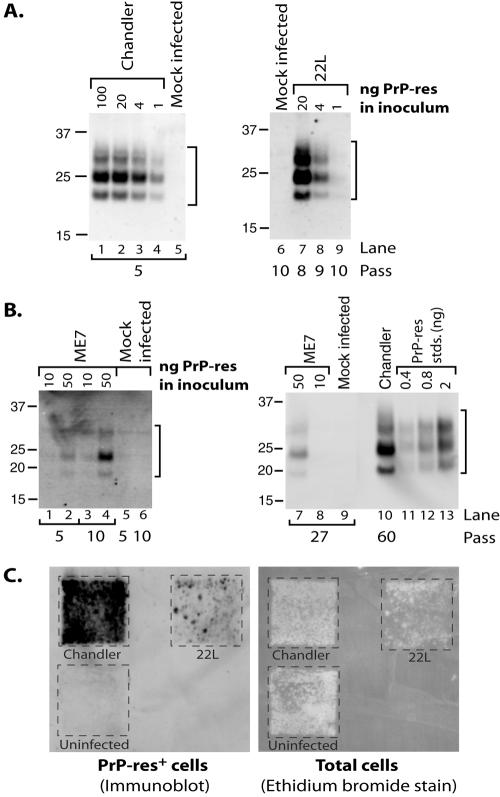
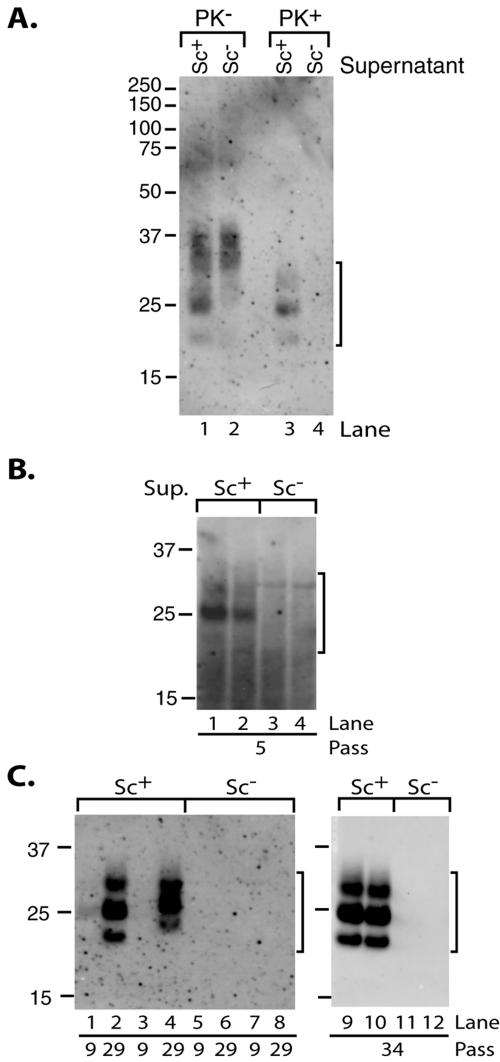
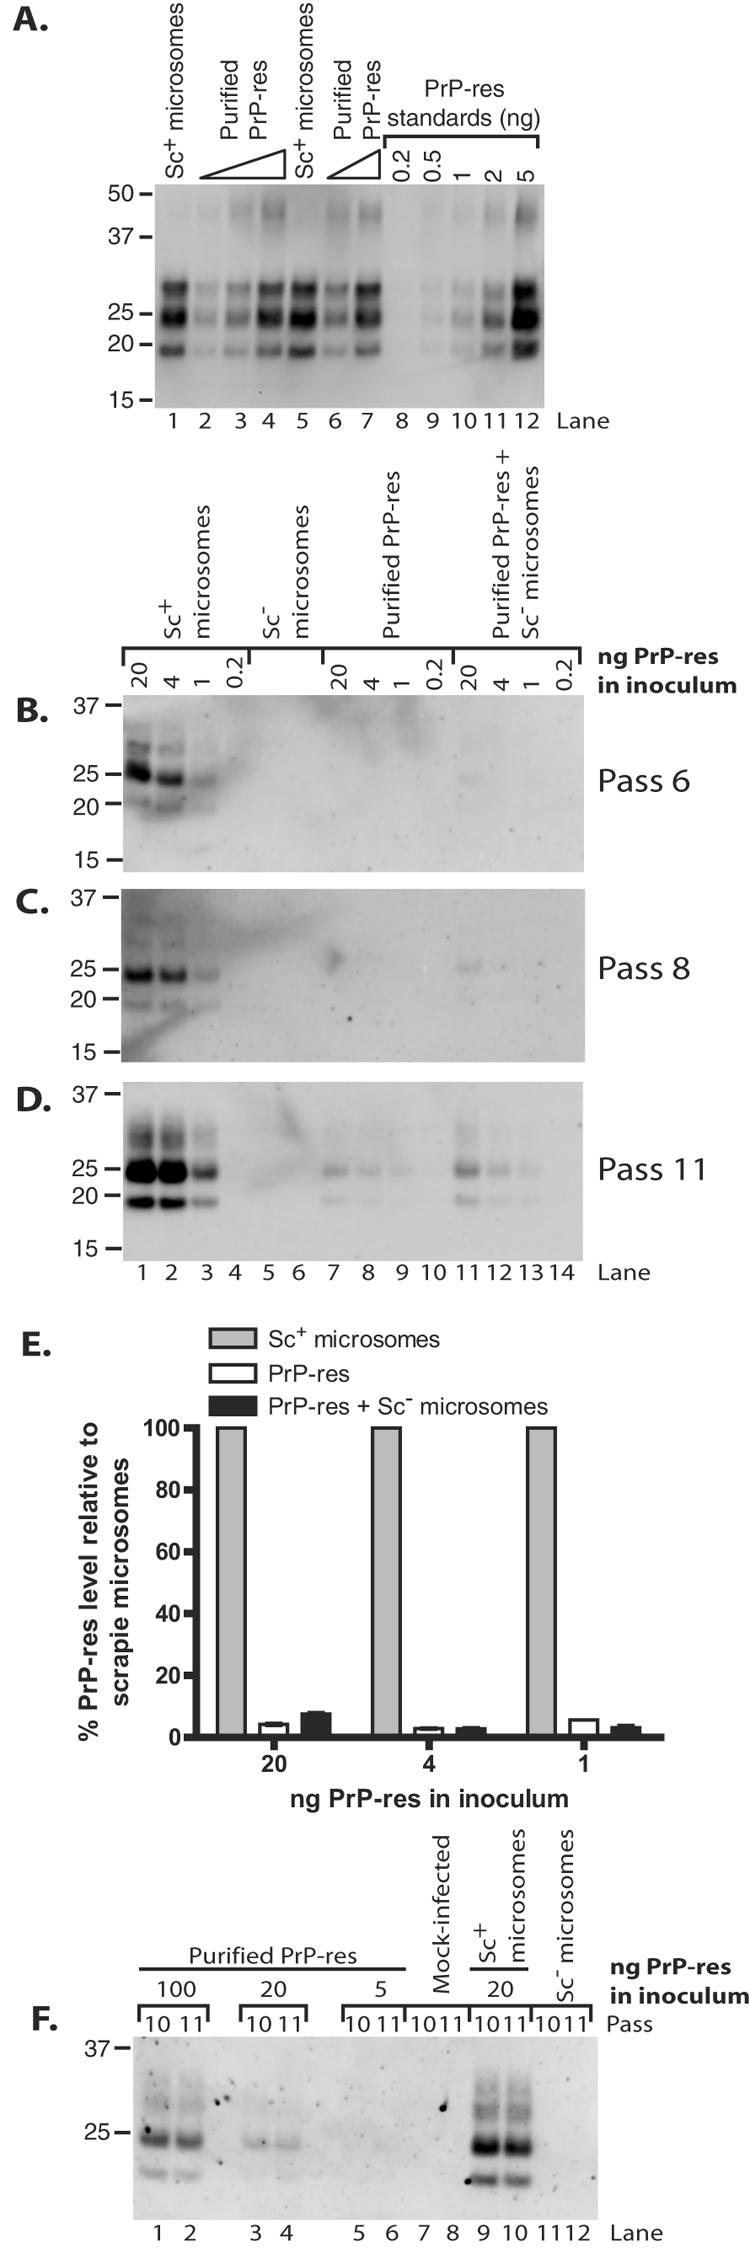
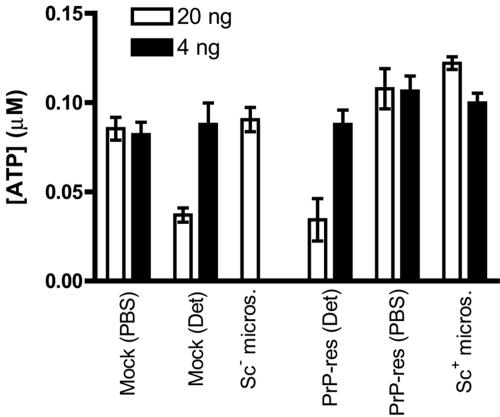
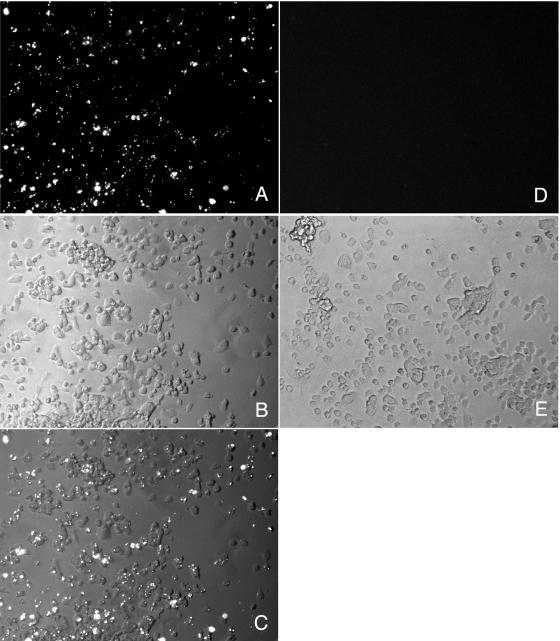
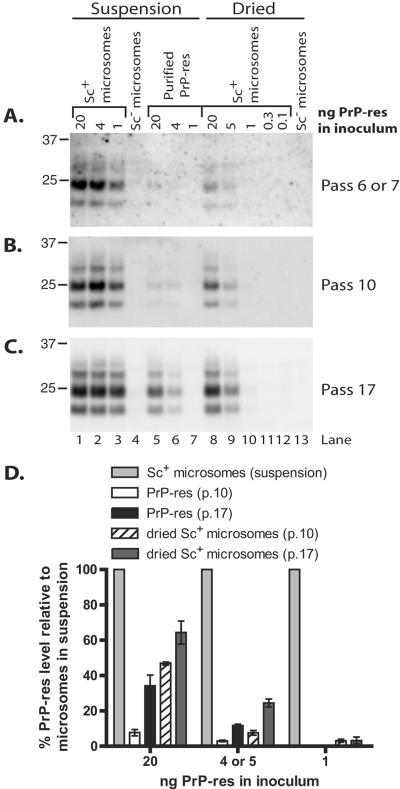
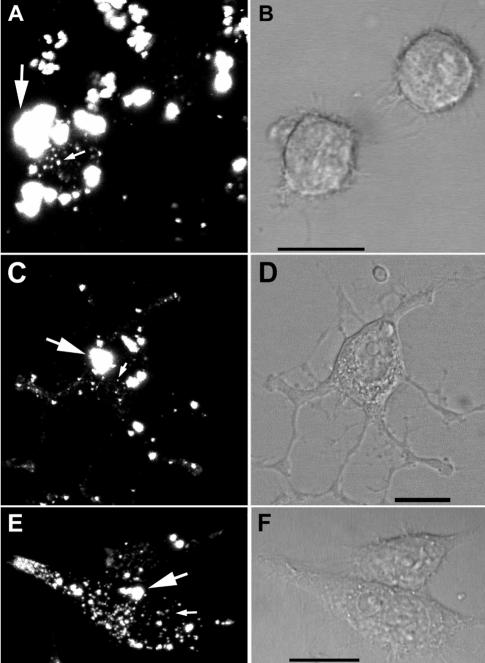
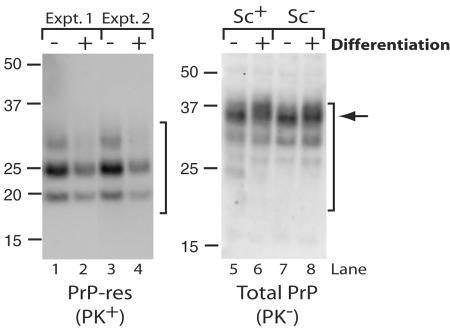
The process by which transmissible spongiform encephalopathy agents, or prions, infect cells is unknown. We employed a new differentiable cell line (SN56) susceptible to infection with three mouse-adapted scrapie strains to gain insight into the cellular infection process. The effect of disease-associated PrP (PrP-res) association with microsomal membranes on infection efficiency was examined by comparing sustained PrP-res production in cells treated with either scrapie brain microsomes or purified, detergent-extracted PrP-res. When normalized for quantity of input PrP-res, scrapie brain microsomes induced dramatically enhanced persistent PrP-res formation compared to purified PrP-res. Infected SN56 cells released low levels of PrP-res into the culture supernatant, which also efficiently initiated infection in recipient cells. Interestingly, microsomes labeled with a fluorescent marker were internalized by SN56 cells in small vesicles, which were subsequently found in neuritic processes. When bound to culture wells to reduce internalization during the infection process, scrapie microsomes induced less long-term PrP-res production than suspended microsomes. Long-term differentiation of infected SN56 cells was accompanied by a decrease in PrP-res formation. Our observations provide evidence that infection of cells is aided by the association of PrP-res with membranes and/or other microsomal constituents.


Figures

FIG. 1.
FIG. 1.
SN56 cells are susceptible to infection with three mouse-adapted scrapie strains. (A and B) SN56 cells were treated with various amounts of PrP-res as contained in crude brain microsome fractions (Chandler [A, lanes 1 to 4] or ME7 [B, lanes 1 to 4 and 7 and 8] or purified form (22L [A, lanes 7 to 9]) from mouse-adapted scrapie-infected animals. Mock-infected control cultures were treated with normal brain microsomes (A, lane 5) normalized for total protein versus a scrapie brain microsome sample (A, lane 2) or a buffer control (A, lane 6; B, lanes 5, 6, and 9). After the indicated number of passes, the cells were assayed for PrP-res by immunoblotting. Chandler-infected cells (from A, lane 2) were analyzed at passage 60 for comparison with ME7-infected cells in panel B (lane 10). Purified PrP-res standards (B, lanes 11 to 13) were used to provide semiquantitative estimates of PrP-res levels. The lanes in panel A represent cell equivalents from 1 well of a 24-well plate (∼150 to 160 μg total cell lysate protein). In panel B, the lanes represent 500 μg (lanes 1 to 6), 733 μg (lanes 7 to 9), and 100 μg (lane 10) of cell lysate protein/lane. Molecular mass markers are indicated in kDa. Brackets indicate PrP-res bands. (C) Cell blot analysis of infected cells. Cells infected with 20 ng of PrP-res from panel A (Chandler, passage 14; 22L, passage 11) were assayed for PrP-res (left). The membrane was then stained with ethidium bromide to visualize transfer of the cells (right).
FIG. 2.
FIG. 2.
Culture supernatant from Chandler-infected cells contains PrP-res and infectivity. (A) Immunoblot detection of PrP-res in culture supernatants of infected cells. Culture supernatants of infected (Sc+, lanes 1 and 3) or uninfected (Sc, lanes 2 and 4) cells (at passage 14) were assayed for total PrP (PK, lanes 1 and 2) or PrP-res (PK+, lanes 3 and 4) using PTA precipitation. (B and C) Immunoblot analysis of cells infected by treatment with culture supernatants. Cells were infected in duplicate wells and passaged independently. After multiple passages, the cells were assayed for PrP-res. Lanes 1 and 2 (B), 1 to 4 (C), and 9 and 10 (C) represent cells treated with culture supernatants from Chandler-infected cells. Lanes 3 and 4 (B), 5 to 8 (C), and 11 and 12 (C) represent cells treated with culture supernatants from uninfected cells. Cells from 1 well of a 6-well plate were loaded per lane in panel B, while cells from 1 well of a 24-well plate were loaded per lane in panel C. Brackets indicate PrP-res bands. The results are representative of three independent experiments using three different culture supernatants, each performed in duplicate. The duplicate samples from one experiment are shown in panels B and C.
FIG. 3.
FIG. 3.
More efficient infection of SN56 and N2a cells by scrapie brain microsomes than by purified PrP-res. (A) Immunoblot quantitation of Chandler PrP-res in purified (lanes 2 to 4 and 6 and 7) and microsome (lanes 1 and 5) preparations. Twofold dilutions of purified PrP-res samples were loaded. Duplicate samples for each preparation are shown. A standard curve was plotted using PK-digested PrP-res standards that were characterized previously (lanes 8 to 12). (B to D) SN56 cells were treated with the indicated amounts of Chandler PrP-res as contained in scrapie (Sc+) microsomes (lanes 1 to 4) or purified from brains of infected animals (lanes 7 to 10). Some infections with purified PrP-res were supplemented with microsomes from normal (Sc) animals (lanes 11 to 14) in quantities normalized for total protein to the corresponding scrapie microsome samples. The cells were treated with normal microsomes normalized for protein content to 20 ng (lane 5) or 4 ng (lane 6) of scrapie microsomes as a control. At the indicated passages (B to D), cells were assayed (100 μg protein/lane) by immunoblotting for PrP-res. Lane numbers in panel D apply to panels B and C also. (E) Quantitation of PrP-res in panel D. The PrP-res level for each scrapie microsome infection was set at 100%. The results are expressed as percent PrP-res signal for each purified PrP-res sample (lanes 7 to 9 and 11 to 13) relative to an infection initiated with the same amount of PrP-res as contained in scrapie brain microsomes. The error bars indicate the range (n = 2). (F) N2a cells were treated with the indicated amounts of Chandler PrP-res as contained in scrapie microsomes (lanes 9 and 10) or purified from brains of infected animals (lanes 1 to 6). Mock-infected control cells were treated with a buffer control (lanes 7 and 8) or normal microsomes (lanes 11 and 12). At the indicated passages, the cells were assayed by immunoblotting for PrP-res. Loading of comparable amounts of protein was verified by comparing total PrP levels in aliquots of the cell lysates not treated with PK (data not shown). The lanes correspond to protein in 99/100 cell equivalents from one well of a six-well plate.
FIG. 4.
FIG. 4.
Removal of detergent from purified PrP-res does not improve infection efficiency. SN56 cell infections were conducted and analyzed as described in the legend to Fig. 3 with the exception that the purified PrP-res was prewashed with PBS to remove the detergent. SN56 cells were treated with the indicated amounts of Chandler PrP-res as contained in scrapie (Sc+) microsomes (lanes 1 to 4) or purified from brains of infected animals (lanes 7 to 10). Some infections with purified PrP-res were supplemented with microsomes from normal (Sc) animals (lanes 11 to 14) in quantities normalized for total protein to the corresponding scrapie microsome samples. The cells were treated with normal microsomes normalized for protein content to 20 ng (lane 5) or 4 ng (lane 6) of scrapie microsomes as a control. At the indicated passages (A and B), the cells were assayed (100 μg protein/lane) by immunoblotting for PrP-res. Lane numbers in panel B apply to panel A also. (C) Quantitation of PrP-res in panel B. The results are expressed as percent PrP-res signal for each purified PrP-res sample (lanes 7 and 8 and 11 to 13) relative to an infection initiated with the same amount of PrP-res as contained in scrapie brain microsomes. The PrP-res level for each scrapie microsome infection was set at 100%. The error bars indicate the range (n = 2).
FIG. 5.
FIG. 5.
Scrapie microsomes and purified PrP-res are not cytotoxic to SN56 cells during acute infection. SN56 cells were treated with either 20 ng (open bars) or 4 ng (black bars) of PrP-res in the form of scrapie microsomes or purified PrP-res preparations as described for cell infections in the legends to Fig. 3 and 4. Purified PrP-res preparations without (PBS) and with (Det) detergent were tested. Mock treatments with either PBS or PBS with the detergent sulfobetaine (0.00055% [open bar] and 0.00011% [black bar]) were included as buffer controls. After 48 h, the cultures were assayed for ATP as a measure of cell viability. The values indicate the mean ± standard deviation of triplicate wells. The results are representative of three independent experiments, each performed in triplicate.
FIG. 6.
FIG. 6.
SN56 cells bind aggregates of purified PrP-res. SN56 cells were treated with 20 ng of purified PrP-res either labeled with a primary amine-reactive dye (Alexa Fluor 568; succinimidyl ester) (A to C) or unlabeled (D and E) and examined by fluorescence microscopy after 2 days. Panels A and D are fluorescent images. Panels B and E are phase-contrast images. Panel C is a merged image of panels A and B.
FIG. 7.
FIG. 7.
Infection with dried microsomes is less efficient than with microsomes in suspension. SN56 cells were plated onto various amounts of scrapie (Sc+) microsomes (lanes 8 to 12) or normal (Sc) microsomes (lane 13) which had been immobilized by drying onto a tissue culture plate. The cells were passaged normally thereafter. Control infections with scrapie microsomes (lanes 1 to 3), normal microsomes (lane 4), or purified PrP-res (lanes 5 to 7) were conducted as described in the legend to Fig. 3. At the indicated passages (A to C), the cells were assayed (panel A, 93 μg protein/lane; panel B, 113 μg protein/lane; panel C, 120 μg protein/lane) by immunoblotting for PrP-res. The lane numbers in panel C also apply to panels A and B. (D) Semiquantitative estimation of PrP-res in panels B and C. The PrP-res level for each infection with scrapie microsomes in suspension was set at 100%. The results are expressed as percent PrP-res signal for each purified PrP-res sample (lanes 5 and 6) or dried microsome sample (lanes 8 to 10) versus an infection initiated with the same amount of PrP-res as contained in scrapie brain microsomes in suspension. The error bars indicate standard deviations (n = 3).
FIG. 8.
FIG. 8.
Efficient internalization and trafficking of fluorescent scrapie microsomes. Scrapie microsomes were labeled with Alexa Fluor 568 as in Fig. 6 and added to SN56 cells. The cells were imaged by laser scanning confocal microscopy. Representative images after 1 h (A and B), 1 day (C and D), and 4 days (E and F) are shown. Panels A, C, and E are fluorescent images. Panels B, D, and F are the corresponding differential interference contrast images. In panels A, C, and E, the large arrows indicate probable aggregates of microsomal material, while the small arrows indicate small internalized microsomal material. Some unbound microsomal material is also visible in panel A. Scale bar, 20 μm. The results shown are representative of cumulative data from three independent infection experiments with at least 49 individual cells examined on each day within the first 5 days of infection.
FIG. 9.
FIG. 9.
Reduced PrP-res formation in differentiated, infected SN56 cells. Chandler-infected (lanes 1 to 6) or uninfected (lanes 7 and 8) SN56 cells were incubated in complete medium (−) or in serum-free medium with cyclic AMP (+) to induce differentiation. The cells were plated to achieve similar densities at the time of harvest (as verified by protein assays). After 4 days, the cells were assayed by immunoblotting for PrP-res (PK+) (lanes 1 to 4) and total PrP (PK) (lanes 5 to 8). Lanes 1 to 4 contained 80 μg of protein/lane, and lanes 5 to 8 contained 10 μg of protein/lane. Brackets indicate PrP-res bands (left) or total PrP bands (right). The arrow indicates differentiation-associated increase in heterogeneity of the fully glycosylated PrP band. The results are representative of three independent cultures, each assayed in triplicate. Examples from two separate experiments are shown in lanes 1 to 4.

References

    1. Aguzzi, A., F. L. Heppner, M. Heikenwalder, M. Prinz, K. Mertz, H. Seeger, and M. Glatzel. 2003. Immune system and peripheral nerves in propagation of prions to CNS. Br. Med. Bull. 66:141-159. - PubMed
    1. Angrand, M., A. Briolay, F. Ronzon, and B. Roux. 1997. Detergent-mediated reconstitution of a glycosyl-phosphatidylinositol-protein into liposomes. Eur. J. Biochem. 250:168-176. - PubMed
    1. Archer, F., C. Bachelin, O. Andreoletti, N. Besnard, G. Perrot, C. Langevin, A. Le Dur, D. Vilette, A. Baron-Van Evercooren, J. L. Vilotte, and H. Laude. 2004. Cultured peripheral neuroglial cells are highly permissive to sheep prion infection. J. Virol. 78:482-490. - PMC - PubMed
    1. Barbosa, J., Jr., A. R. Massensini, M. S. Santos, S. I. Meireles, R. S. Gomez, M. V. Gomez, M. A. Romano-Silva, V. F. Prado, and M. A. Prado. 1999. Expression of the vesicular acetylcholine transporter, proteins involved in exocytosis, and functional calcium signaling in varicosities and soma of a murine septal cell line. J. Neurochem. 73:1881-1893. - PubMed
    1. Baron, G. S., and B. Caughey. 2003. Effect of glycosylphosphatidylinositol anchor-dependent and -independent prion protein association with model raft membranes on conversion to the protease-resistant isoform. J. Biol. Chem. 278:14883-14892. - PubMed

Publication types