. 2006 Apr;147(8):905-16.
doi: 10.1038/sj.bjp.0706678.

Mechanism of hERG K+ channel blockade by the fluoroquinolone antibiotic moxifloxacin

Affiliations

Mechanism of hERG K+ channel blockade by the fluoroquinolone antibiotic moxifloxacin

Ari J Alexandrou et al. Br J Pharmacol. 2006 Apr.

Abstract

The fluoroquinolone antibiotic moxifloxacin has been associated with the acquired long QT syndrome and is used as a positive control in the evaluation of the QT-interval prolonging potential of new drugs. In common with other QT-prolonging agents, moxifloxacin is known to inhibit the hERG potassium K+ channel, but at present there is little mechanistic information available on this action. This study was conducted in order to characterise the inhibition of hERG current (I(hERG)) by moxifloxacin, and to determine the role in drug binding of the S6 aromatic amino-acid residues Tyr652 and Phe656. hERG currents were studied using whole-cell patch clamp (at room temperature and at 35-37 degrees C) in an HEK293 cell line stably expressing hERG channels. Moxifloxacin reversibly inhibited currents in a dose-dependent manner. We investigated the effects of different voltage commands to elicit hERG currents on moxifloxacin potency. Using a 'step-ramp' protocol, the IC50 was 65 microM at room temperature and 29 microM at 35 degrees C. When a ventricular action potential waveform was used to elicit currents, the IC50 was 114 microM. Block of hERG by moxifloxacin was found to be voltage-dependent, occurred rapidly and was independent of stimulation frequency. Mutagenesis of the S6 helix residue Phe656 to Ala failed to eliminate or reduce the moxifloxacin-mediated block whereas mutation of Tyr652 to Ala reduced moxifloxacin block by approximately 66%. Our data demonstrate that moxifloxacin blocks the hERG channel with a preference for the activated channel state. The Tyr652 but not Phe656 S6 residue is involved in moxifloxacin block of hERG, concordant with an interaction in the channel inner cavity.


Figures

Figure 1
Figure 1
Moxifloxacin inhibition of hERG currents is weakly temperature-sensitive. (a) ‘Step-ramp' voltage command used to evoke hERG currents. Cells were voltage-clamped at −80 mV and depolarised to +20 mV for 1 s followed by a repolarising ramp back to −80 mV at a rate of 0.5 mV ms−1. The command was applied every 4 s. Peak hERG current amplitude, and the effects of 60 μM and 1 mM moxifloxacin thereon, was measured during the repolarising phase as indicated in the example traces shown. (b) This graph illustrates the effects of cumulative concentrations of moxifloxacin (0.1, 0.3 and 1 mM) on peak hERG amplitude with time. Dofetilide (10 μM) was added at the end of the experiment as a positive control. (c) A moxifloxacin concentration–response curve was generated for experiments conducted at 22°C and at 35°C. Data are shown fitted to a Hill equation of the form formula image where A1 and A2 are 0 and 100% inhibition, respectively, C is the IC50 concentration and nH is the Hill slope. The IC50 values yielded under these two experimental conditions were statistically different from one another (P<0.001). The inset shows the concentration–response curve at 22°C for levofloxacin generated using the step-ramp voltage protocol. Data are from six cells and a Hill equation was fitted as for moxifloxacin.
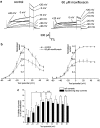
Figure 2
Figure 2
Potency of moxifloxacin is reduced by using a physiological type waveform. (a) This panel illustrates an example of currents evoked using the ‘step-step' voltage protocol, as illustrated. Cells were depolarised to +20 mV for 2 s followed by a step to −40 mV for 4 s to elicit tail currents; this voltage command was applied every 12 s. The effect of moxifloxacin on peak tail current amplitude was measured and multiple concentrations were cumulatively applied to each cell. (b) A ventricular action potential (VAP) waveform was also used to evoke hERG currents. This protocol, illustrated, was applied every 2 s. Example current traces elicited using this waveform are shown, and the effect of moxifloxacin on peak repolarising currents was measured. (c) Dose–response curves using the ‘step-step' and VAP protocols are shown with the ‘step-ramp' dose–response (at 22°C) curve for comparison. As in Figure 1c, data were fitted to a Hill equation where % inhibition was constrained between 0 and 100%. Values for IC50s and Hill slopes, nH, are indicated.
Figure 3
Figure 3
Voltage-dependence of moxifloxacin block. (a) Representative examples of current traces recorded in the absence (left-hand panel) and presence (right-hand panel) of 60 μM moxifloxacin. Currents were evoked by stepping from −80 mV to test potentials between −60 and +50 mV for 5 s followed by a repolarising step to −40 mV. For clarity, some of the voltage traces have been omitted in this figure. (b) This shows the mean current–voltage relationship for currents measured at the end of the depolarising step (left-hand panel) and for tail currents (right-hand panel) in control and in the presence of 60 μM moxifloxacin. Tail currents for each individual cell were normalised to the maximum obtained in the absence of drug, and fitted with a Boltzmann function of the form formula image where A1 and A2 are 0 and 1 respectively, V1/2 is the half-activation voltage and k is the slope factor. (c) Mean % inhibition of both tail currents (open bars) and depolarising step currents (solid bars) were calculated at each test potential and are summarised here.
Figure 4
Figure 4
Time-dependence of hERG block by moxifloxacin. (a) Cells were depolarised from the holding potential of −80 mV to 0 mV for 5 s until a steady-state response was observed. Moxifloxacin was then bath-applied for 3 min while the channels were held in a closed state by voltage-clamping the cell at −80 mV. The voltage command was then again repeated in the presence of moxifloxacin. The representative traces in the left-hand panel indicate the last pulse prior to, and the first pulse after, application of 60 μM moxifloxacin. The right-hand panel shows the mean development of block over time by 60 μM moxifloxacin from five experiments. Full extent of block was observed within 1 s and was maintained for the 5 s duration. The development of block could be fit by a single exponential yielding a mean τ of 243.5±9.5 ms. (b) An envelope of tails protocol, as illustrated in the inset, was used to investigate time-dependence of channel block. Cells were depolarised to +20 mV for periods of time from 10 to 1400 ms before repolarising to −40 mV to elicit tail currents. Peak tail currents were measured in control conditions and after equilibration of cells in 60 μM moxifloxacin. For clarity, not all current traces are shown. (c) This panel shows the increase in tail current with length of the depolarising step for the cell illustrated in (b), in the absence and presence of moxifloxacin. (d) Summary of mean data from envelope of tails experiments where mean % inhibition of tail currents is plotted as a function of pulse duration. Significant inhibition (26.8±4.8%; n=5) was observed with a 40 ms step. Inhibition appeared to further increase as pulse duration was incrementally lengthened; however, the changes were not statistically significant.
Figure 5
Figure 5
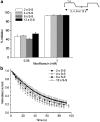
Effects of moxifloxacin on hERG current inactivation. (A) This panel shows examples of steady-state inactivation curves under control conditions (closed symbols) and in the presence of 60 μM moxifloxacin (open symbols). To elicit steady-state inactivation, following a 500 ms step to +40 mV, 10 ms pulses were applied to potentials between −130 and +40 mV in 10 mV increments, followed by a second 500 ms step to +40 mV. Current amplitudes elicited during the final step to +40 mV were measured, normalised and plotted as a function of the preceding test potential to yield a steady-state inactivation curve. In this cell, the mean V1/2(inact) under control conditions was −69.3 mV (slope 15.4 mV) and in the presence of moxifloxacin, −73.4 mV (slope 16.2 mV). (B) Example traces in the upper panel (a) illustrate the effects of moxifloxacin on inactivation kinetics. Part of the voltage command is shown in the inset: cells were depolarised to +40 mV for 500 ms and then briefly stepped to −100 mV followed by a subsequent step to test potentials ranging from −40 to +40 mV. An example recording under control conditions is shown in the left-hand panel and in the presence of 60 μM moxifloxacin in the right-hand panel. For clarity, not all the current traces are shown. The outward currents elicited during this final step were then fitted to a single exponential function to yield a time constant at each test potential. (b) Time constants were plotted versus test potential as shown in the graph. The inset shows an example of currents in the absence and presence of moxifloxacin at −20 mV, which have been normalised and overlayed.
Figure 6
Figure 6
Frequency-dependence of moxifloxacin block. (a) Summary of the effects of 60 μM and 1 mM moxifloxacin on % inhibition of tail current amplitudes obtained from experiments using the step-ramp protocol applied with different start-to-start intervals of 2, 4, 8 or 12 s, as shown in the voltage protocol (inset). The effects of 60 μM moxifloxacin with a 4 s start-to-start interval are predicted from the dose–response curve shown in Figure 1c. (b) To investigate frequency-dependence, the rate of decline of current in response to 1 mM moxifloxacin (normalised to the current immediately prior to the onset of drug effects) was plotted versus time for each experimental condition (i.e. 2, 4, 8 or 12 s start-to-start interval).
Figure 7
Figure 7
Effects of the S6 mutations Y652A and F656A on moxifloxacin block of hERG channel. (A) Effects of the Y652A mutation on the action of moxifloxacin. (a) Representative current traces. Left-hand panel shows example current traces of the effects of a high (∼20-fold the IC50) concentration of moxifloxacin (600 μM) on wild-type hERG current (upper traces) and on Y652A hERG current (middle traces). Lower trace shows the voltage-protocol used. In each case, hERG tail amplitude was measured as the difference between the peak outward tail current at −40 mV and the instantaneous current activated by the brief depolarisation from −80 to −40 mV. (b) Mean±s.e.m. fractional-block data for Y652A hERG currents and its corresponding control (n=5 cells for each). (c) Mean±s.e.m. fractional block data for Y652A hERG tails following voltage-commands to −20, 0, +20 and +40 mV. Data are from five cells. (B) Effects of the F656A mutation on the action of moxifloxacin. (a) The voltage protocol used to elicit currents is shown as an inset to the figure, while the lower trace in (a) shows an expanded portion of the protocol, comprised of the repolarising step from +20 to −120 mV. Upper set of current traces contains example records of WT IHERG in the absence (Control) and presence of 600 μM moxifloxacin; lower current traces show similar data for the F656A HERG mutant. (b) Mean±s.e.m. fractional block data (n=5 cells for each) for F656A IHERG and its corresponding control.

References

    1. AMANKWA K., KRISHNAN S.C., TISDALE J.E. Torsades de pointes associated with fluoroquinolones: importance of concomitant risk factors. Clin.l Pharmacol. Ther. 2004;75:242–247. - PubMed
    1. BARRIERE S., GENTER F., SPENCER E., KITT M., HOELSCHER D., MORGANROTH J. Effects of a new antibacterial, telavancin, on cardiac repolarization (QTc interval duration) in healthy subjects. J. Clin. Pharmacol. 2004;44:689–695. - PubMed
    1. BARRY P.H. JPCalc, a software package for calculating liquid junction potential corrections in patch-clamp, intracellular, epithelial and bilayer measurements and for correcting junction potential measurements. J. Neurosci. Methods. 1994;51:107–116. - PubMed
    1. BISCHOFF U., SCHMIDT C., NETZER R., PONGS O. Effects of fluoroquinolones on HERG currents. Eur. J. Pharmacol. 2000;406:341–343. - PubMed
    1. BOSCH R.F., GASPO R., BUSCH A.E., LANG H.J., LI G.-R., NATTEL S. Effects of the chromanol 293B, a selective blocker of the slow, component of the delayed rectifier K+ current, on repolarization in human and guinea pig ventricular myocytes. Cardiovasc. Res. 1998;38:441–450. - PubMed