. 2006 Oct;134(5):1092-101.
doi: 10.1017/S0950268806005863. Epub 2006 Feb 14.

Evaluation of measures to reduce international spread of SARS

Affiliations

Evaluation of measures to reduce international spread of SARS

K Glass et al. Epidemiol Infect. 2006 Oct.

Abstract

Mathematical models are used to quantify the effect of border control measures in reducing the international spread of SARS. Border screening is shown to play a relatively minor role in reducing disease spread. Assuming detection rates similar to those reported for arrival screening in Australia, screening can detect up to 10% (95% CI 3-23) of infected travellers, and reduce the probability of a large outbreak by up to 7% (95% CI 2-17). Rapid reductions in the time to diagnosis and effective facilities for the isolation of cases are essential to ensure that there will not be a large outbreak, and each week of delay in responding to imported infection approximately doubles the total number of cases. While the control response is being developed in a currently uninfected region, border screening can provide up to one week's additional time in which to improve methods for early isolation of cases.


Figures

Fig. 1
Fig. 1
The proportion of infected travellers that are detected by border screening. The sensitivity of the screening technique is the proportion of symptomatic travellers that are detected by screening. The sensitivity calculated for Australian border screening (solid line) with 95% confidence bounds (dotted lines) are also shown.
Fig. 2
Fig. 2
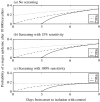
The probability that there will be a major epidemic in the uninfected region after 10 000 travellers have arrived from the infected region. (a) The plot assumes that border screening is not in place; (b) the plot assumes that border screening is in place, and that it has 13·8% sensitivity, and (c) the plot assumes that border screening is in place and that it has 100% sensitivity for symptomatic travellers. Curve A gives the case where control measures are instituted in the infected region only. Curve B assumes that in addition to control measures in the infected region, information on the disease is supplied to travellers so that they too are isolated more quickly. Curve C combines control in the infected region and information to travellers with preparedness in the uninfected region, so that any new case in the (initially) uninfected region is also isolated quickly.
Fig. 3
Fig. 3
(a) The plot shows the time from onset of symptoms to isolation of cases over time in the model. The curve from week 0 onwards has been fitted to data from the SARS outbreak in Singapore [7]. Each week before week 0 corresponds to 1 week's delay in implementing control measures. (b) The plot shows the effect of 1, 2, or 3 weeks' delay on the mean total number of cases, assuming that the outbreak is initiated by three primary cases, and involves at least 10 cases in total.
Fig. 4
Fig. 4
The probability, expressed as a percentage, that there will be an outbreak of at least 100 cases in an uninfected region over a period of 30 days, assuming that there are 1000 travellers arriving from the infected region each day, and that the time from onset to isolation follows the curve in Figure 3a. The x-axis represents the first week of the 30-day period, labelled as in Figure 3a, and the y-axis represents the screening sensitivity. Curves in the figure show the contours of equal probability, so that the curve marked ‘10’ corresponds to conditions that will produce a 10% probability of an outbreak of at least 100 cases during the 30-day period. The sensitivity calculated for Australian border screening (dashed line) with 95% confidence bounds (dotted lines) are also shown.

Similar articles

Cited by

References

    1. Bell DM. the World Health Organisation Working Group on Prevention of International and Community Transmission of SARS. Public health interventions and SARS spread, 2003. Emerging Infectious Diseases. 2004;10:1900–1906. and . - PMC - PubMed
    1. Hong Kong Department of Health http://www.sars-expertcom.gov.hk/english/reports/reports/reports_fullrpt.... http://www.sars-expertcom.gov.hk/english/reports/reports/reports_fullrpt... . SARS in Hong Kong: from experience to action 2006 ( ). Accessed 19 January 2006. - PubMed
    1. Health Canada http://www.phac-aspc.gc.ca/publicat/sars-sras/naylor/index.html. http://www.phac-aspc.gc.ca/publicat/sars-sras/naylor/index.html . Learning from SARS – renewal of public health in Canada 2006 ( ). Accessed 19 January 2006.
    1. Wilder-Smith A, Goh KT, Paton NI. Experience of severe acute respiratory syndrome in Singapore: importation of cases, and defense strategies at the airport. Journal of Travel Medicine. 2004;10:259–262. - PMC - PubMed
    1. Samaan G et al. Border screening for SARS in Australia: what has been learnt. Medical Journal of Australia. 2004;180:220–223. - PubMed

Publication types

MeSH terms