. 2006 Feb 20;203(2):401-12.
doi: 10.1084/jem.20051129. Epub 2006 Feb 13.

Isoprenoids determine Th1/Th2 fate in pathogenic T cells, providing a mechanism of modulation of autoimmunity by atorvastatin

Affiliations

Isoprenoids determine Th1/Th2 fate in pathogenic T cells, providing a mechanism of modulation of autoimmunity by atorvastatin

Shannon E Dunn et al. J Exp Med. .

Abstract

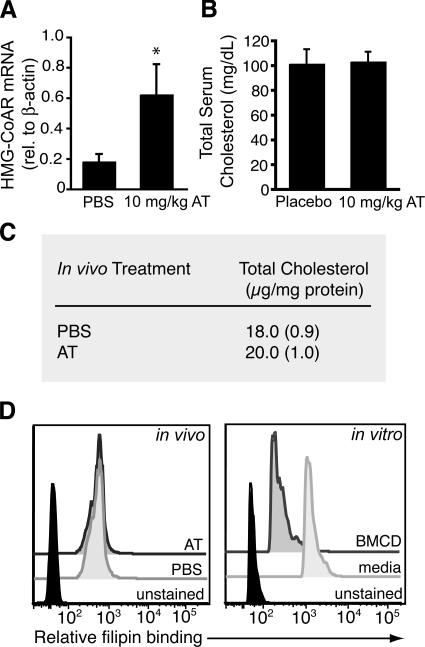
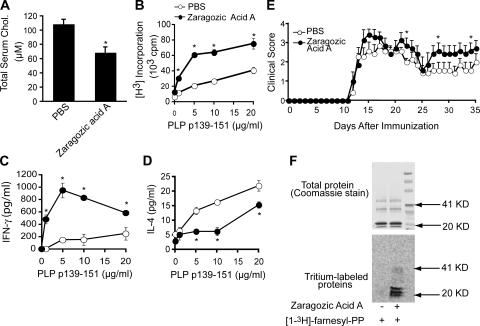
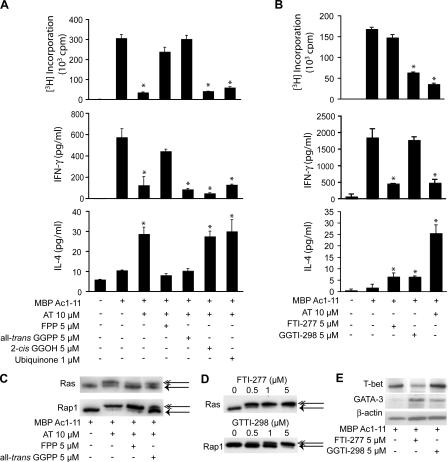
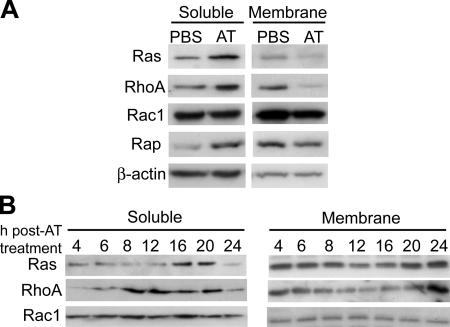
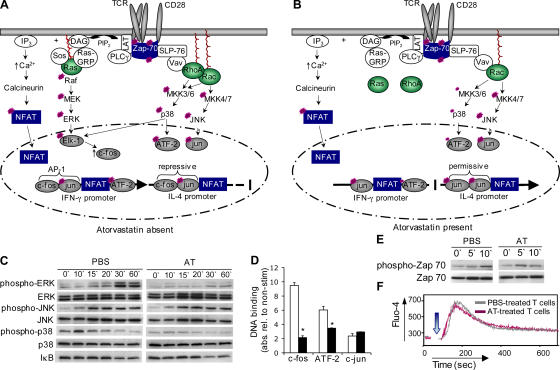
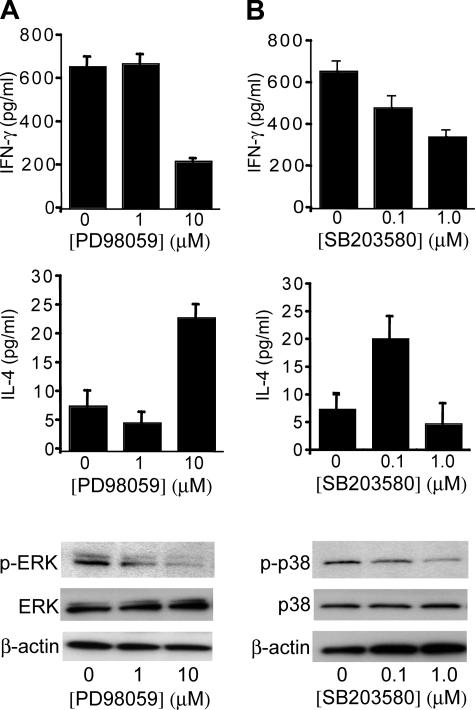
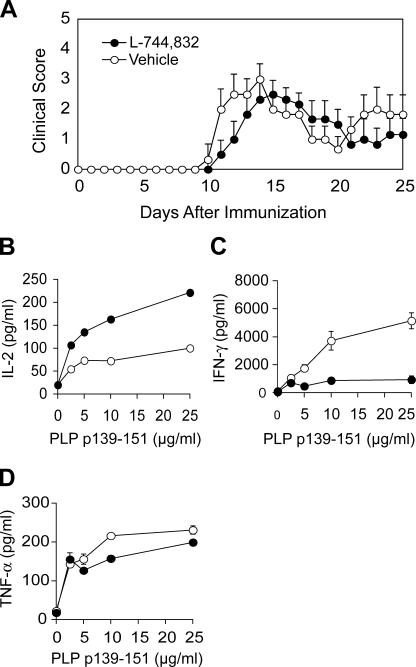
3-hydroxy-3-methylglutaryl-coenzyme A (HMG-CoA) reductase is a critical enzyme in the mevalonate pathway that regulates the biosynthesis of cholesterol as well as isoprenoids that mediate the membrane association of certain GTPases. Blockade of this enzyme by atorvastatin (AT) inhibits the destructive proinflammatory T helper cell (Th)1 response during experimental autoimmune encephalomyelitis and may be beneficial in the treatment of multiple sclerosis and other Th1-mediated autoimmune diseases. Here we present evidence linking specific isoprenoid intermediates of the mevalonate pathway to signaling pathways that regulate T cell autoimmunity. We demonstrate that the isoprenoid geranylgeranyl-pyrophosphate (GGPP) mediates proliferation, whereas both GGPP and its precursor, farnesyl-PP, regulate the Th1 differentiation of myelin-reactive T cells. Depletion of these isoprenoid intermediates in vivo via oral AT administration hindered these T cell responses by decreasing geranylgeranylated RhoA and farnesylated Ras at the plasma membrane. This was associated with reduced extracellular signal-regulated kinase (ERK) and p38 phosphorylation and DNA binding of their cotarget c-fos in response to T cell receptor activation. Inhibition of ERK and p38 mimicked the effects of AT and induced a Th2 cytokine shift. Thus, by connecting isoprenoid availability to regulation of Th1/Th2 fate, we have elucidated a mechanism by which AT may suppress Th1-mediated central nervous system autoimmune disease.


Figures

Figure 1.
Figure 1.
The mevalonate pathway intermediate farnesyl-PP and its alcohol precursor farnesol reverse the Th2 bias promoted by atorvastatin. (A) The mevalonate pathway. Metabolites and enzymes in the pathway are shown in black, drug inhibitors are shown in red, alcohol precursors to metabolites are shown in green, and HMG-CoA reductase and pathway end-products are shown in blue. CoQ, coeznyme Q10/ubiquinone. (B) Purified naive B10.Pl CD4+ cells stimulated with 5 μg/ml αCD3/αCD28 were cultured in the presence or absence of 10 μM atorvastatin (AT), 100 μM mevalonate, or 5 μM farnesyl-PP. Proliferation (top) was measured by [3H]-thymidine incorporation, and IFN-γ (middle) and IL-4 (bottom) accumulation in culture supernatants were measured by ELISA. These metabolite doses were optimal in reversal of AT effects. Values are mean ± SE of three cultures. Results are representative of three independent experiments. *, denotes a significant (P < 0.05) difference from αCD3/αCD28 stimulation group. (C and D) Female SJL mice (n = 10/group) were immunized with PLP p139-151 in CFA and daily were fed PBS or AT (10 mg/kg) and/or were injected with farnesol (FOH) (5 mg/kg, i.p.). At day 10 after immunization, two spleens were taken from representative mice in each group and pooled, and isolated splenocytes were cultured ex vivo with PLP p139-151 peptide. C shows the mean ± SE clinical scores of these mice, whereas D shows the proliferation of [3H] incorporation (left), IFN-γ (middle), and IL-4 (right) production by these cells. *, denotes a significant difference from (P < 0.05) PBS control.
Figure 2.
Figure 2.
Oral atorvastatin treatment does not affect circulating or T cell cholesterol. (A) B10.PL mice (n = 4/group) were treated with either PBS or 10 mg/kg atorvastatin (AT) for 30 d after which time the liver was removed and HMG-CoA reductase (HMG-CoAR) transcript levels were assessed using real-time RT-PCR. *, denotes a significant difference (P < 0.05) from PBS liver. (B) Serum levels of total cholesterol (mg/dL) in mice treated orally with PBS or AT (10 mg/kg). Serum was taken from mice at 5 d after treatment in the morning after an overnight fast. Values are mean ± SE of five mice. (C) T cells were isolated from the spleens of mice treated as in B and total cholesterol (μg/mg protein) was measured in lipid extracts of these cells using the Amplex Red Cholesterol Assay. (D) Flow cytometric analysis of filipin staining in purified T cells taken from mice treated as in B (left) or in T cells that were incubated in vitro in serum-free media for 2 h with the cholesterol-depleting agent β-methyl-cyclodextrin (BMCD) (right). The latter experiment served as a positive control to demonstrate the sensitivity of this assay to detect cholesterol changes.
Figure 3.
Figure 3.
Specific inhibition of the sterol branch of the mevalonate pathway enhances T cell proliferation and Th1 differentiation. SJL mice (n = 10/group) were immunized with PLP p139-151 in CFA and were injected once daily with either PBS or Zaragozic Acid A (10 mg/kg, i.p.). At day 10 after immunization, axillary, brachial, and inguinal lymph nodes were taken from representative mice in each group and pooled, and isolated cells were cultured ex vivo with PLP p139-151 peptide. (A) Total cholesterol (μM) in serum taken at the peak of disease activity. Values are mean ± SE of five mice. (B–D) Proliferation of PLP p139-151 reactive cells (B) was measured by [3H]-thymidine incorporation, and IFN-γ (C) and IL-4 (D) accumulation in culture media was measured by ELISA. Values are mean ± SE of three cultures. (E) Mean ± SE clinical scores of mice in the various groups over the time-course of disease are shown. *, denotes a difference (P < 0.05) from PBS control. (F) De novo incorporation of [1-3H]-farnesyl-PP into cellular proteins in the absence or presence of Zaragozic Acid A (200 μM) in T cell cultures. The protein marker is in lane 3 (top). Gels were stained with Coomassie blue to ensure that equivalent amounts of each protein sample were loaded.
Figure 4.
Figure 4.
Prenylated proteins have a regulatory function in T cell growth and differentiation. (A and B) Splenocytes taken from MBP Ac1-11 TCR Tg mice were stimulated with 5 μg/ml Ac1-11 peptide in the presence or absence of 10 μM atorvastatin (AT), 5 μM farnesyl-PP (FPP), 5 μM all-trans geranylgeranyl-PP (all-trans GGPP), 1 μM 2-cis geranylgeraniol (2-cis GGOH), or 1 μM ubiquinone (all in A) or DMSO vehicle, 5 μM of the farnesyltransferase inhibitor FTI-277 or 5 μM of the geranylgeranyltransferase-I inhibitor GGTI-298 (all in B). Proliferation (top) was measured by [3H]-thymidine incorporation, and IFN-γ (middle), and IL-4 (bottom) accumulation in culture supernatants was measured via ELISA. These results are representative of data from at least three independent experiments. *, denotes a difference (P < 0.05) from peptide stimulation alone. Note that the additive effects of FTI and GGTI were not examined in these experiments because this drug combination compromised T cell viability (not depicted). Values are mean ± SE of triplicate cultures. (C) 5 μM farnesyl-PP is effective at restoring the prenylation of Ras, a representative farnesylated protein and 5 μM all-trans GGPP is effective at restoring the prenylation of Rap, a representative geranylgeranylated protein. Because the carboxy-termini of these proteins are cleaved upon prenylation, posttranslationally modified forms (single arrows) of these proteins can be distinguished from their unprenylated forms (double arrows) via altered mobility on Western blots of SDS-PAGE gels (reference 27). (D) 1 and 5 μM of FTI-277 and 5 μM GGTI-298, respectively, inhibit Ras farnesylation and Rap1 geranylgeranylation. (E) Protein samples from cells treated with FTI, GGTI, or vehicle control (as in B) were subjected to Western blot analysis of T-bet and GATA-3 expression.
Figure 5.
Figure 5.
Oral atorvastatin treatment decreases the membrane association of Ras and RhoA GTPases. (A) Lymph node cells were taken from five (SJL×PLJ)F1 mice that had been immunized 10 d previously with MBP Ac1-11 in CFA. These mice had been fed daily with either PBS or AT (10 mg/kg). At 16 h after the last dosing, lymph nodes were taken from mice and pooled, and the soluble and membrane fractions of these cells were separated by ultracentrifugation (100,000 g). Proteins were subjected to SDS-PAGE electrophoresis and Western blot analysis of Ras, RhoA, Rap, Rac1, and β-actin was performed. (B) B10.Pl mice (n = 2/group) were fed with AT (10 mg/kg) once daily for 3 d. After the third treatment, spleens were taken from mice at different time points. Splenocytes were isolated, the soluble and membrane fractions were obtained, and Western blot analysis of Ras, RhoA, and Rac1 expression was performed as in A.
Figure 6.
Figure 6.
Oral atorvastatin treatment inhibits ERK and p38 signaling pathways in T cells. (A and B) Cartoon summarizing the location of prenylated proteins (in green) in signaling pathways downstream of TCR stimulation and the transcription factors that act at IFN-γ and IL-4 promoters in PBS- (A) and AT-dosed (B) mice. Not all pathway intermediates are shown. (C–E) Lymph node cells (C and D) or purified CD4+ cells (E) taken from mice treated as in Fig. 5 were cultured (2 × 10⁶/ml) with 5 μg/ml αCD3 and 5 μg/ml αCD28 antibodies for various durations. (C) Western blot analysis of phospho-ERK, ERK, phospho-JNK, JNK, phospho-p38, p38 MAPK, and IκB using whole cell lysates prepared from these cells. (D) shows results of an ELISA-based DNA binding assay of c-fos, ATF-2, and c-jun using nuclear extracts prepared from parallel cultures that were stimulated with 5 μg/ml αCD3/αCD28 antibodies for 10 h. (E) Western blot analysis of phospho-Zap 70 and Zap 70 in lysates of these cells. (F) FACS analysis of calcium flux in CD4+ T cells in response to anti-CD3 cross-linking. The arrow denotes the time when the stimulus was added to cells.
Figure 7.
Figure 7.
MEK and p38 inhibitors induce Th2 bias of naive CD4+ cells. Naive CD4+ T cells were isolated from spleens of MBP Ac1-11 TCR Tg mice and were cultured with specific peptide in the presence or absence of 5 μg/ml MBP Ac1-11, 1, or 10 μM of the MEK inhibitor PD98059 (A) or 0.1–1 μM of the p38 inhibitor SB203580 (B). Note that these particular doses of MEK or p38 inhibitors did not affect the proliferation or viability of T cells (data not depicted), but did inhibit the phosphorylation of ERK and p38 (bottom). *, denotes a significant (P < 0.05) difference from MBP Ac1-11 stimulated group. β-actin served as a loading control. Values are mean ± SE of triplicate cultures.
Figure 8.
Figure 8.
In vivo administration of the FTI L-744,832 inhibits Th1 differentiation. Female SJL mice were immunized with PLP p139-151 in CFA and daily were injected s.c. with either vehicle or L-744,832 (30 mg/kg). At day 10 after immunization, spleens were taken from representative mice in each group and isolated splenocytes were cultured ex vivo with PLP p139-151 peptide. (A) The mean ± SE clinical scores of these mice. (B–D) PLP p139-151-stimulated production of IL-2 (B), IFN-γ (C), and TNF-α (D) by isolated splenocytes. Values are mean ± SE of triplicate cultures. *, denotes a significant difference from vehicle control.

References

    1. Vollmer, T., L. Key, V. Durkalski, W. Tyor, and J. Corboy. 2004. Oral simvastatin treatment in relapsing-remitting multiple sclerosis. Lancet. 363:1607–1608. - PubMed
    1. McCarey, D.W., I.B. McInnes, R. Madhok, R. Hampson, O. Scherbakov, I. Ford, H.A. Capell, and N. Sattar. 2004. Trial of atorvastatin in Rheumatoid Arthritis (TARA): double-blind, randomised placebo-controlled trial. Lancet. 363:2015–2021. - PubMed
    1. Neuhaus, O., O. Stuve, S.S. Zamvil, and H.-P. Hartung. 2004. Are statins a treatment option for multiple sclerosis. Lancet Neurol. 3:369–371. - PubMed
    1. Stanislaus, R., K. Pahan, A.K. Singh, and I. Singh. 1999. Amelioration of experimental allergic encephalomyelitis in Lewis rats by lovastatin. Neurosci. Lett. 269:71–74. - PubMed
    1. Youssef, S., O. Stuve, J.C. Patarroyo, P.J. Ruiz, J.L. Radosevich, E.M. Hur, M. Bravo, D. Mitchell, R.A. Sobel, L. Steinman, and S.S. Zamvil. 2002. The HMG-CoA reductase inhibitor atorvastatin, promotes Th2 bias and reverses paralysis in central nervous system autoimmune disease. Nature. 420:78–84. - PubMed

Publication types

MeSH terms