. 2006 Feb 13;172(4):529-40.
doi: 10.1083/jcb.200507081.

Early aging-associated phenotypes in Bub3/Rae1 haploinsufficient mice

Affiliations

Early aging-associated phenotypes in Bub3/Rae1 haploinsufficient mice

Darren J Baker et al. J Cell Biol. .

Abstract

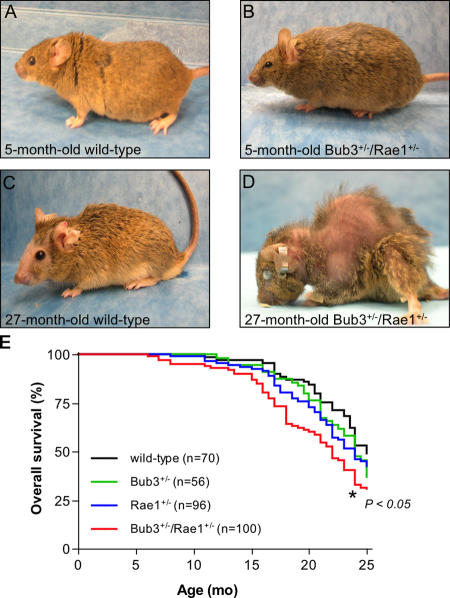
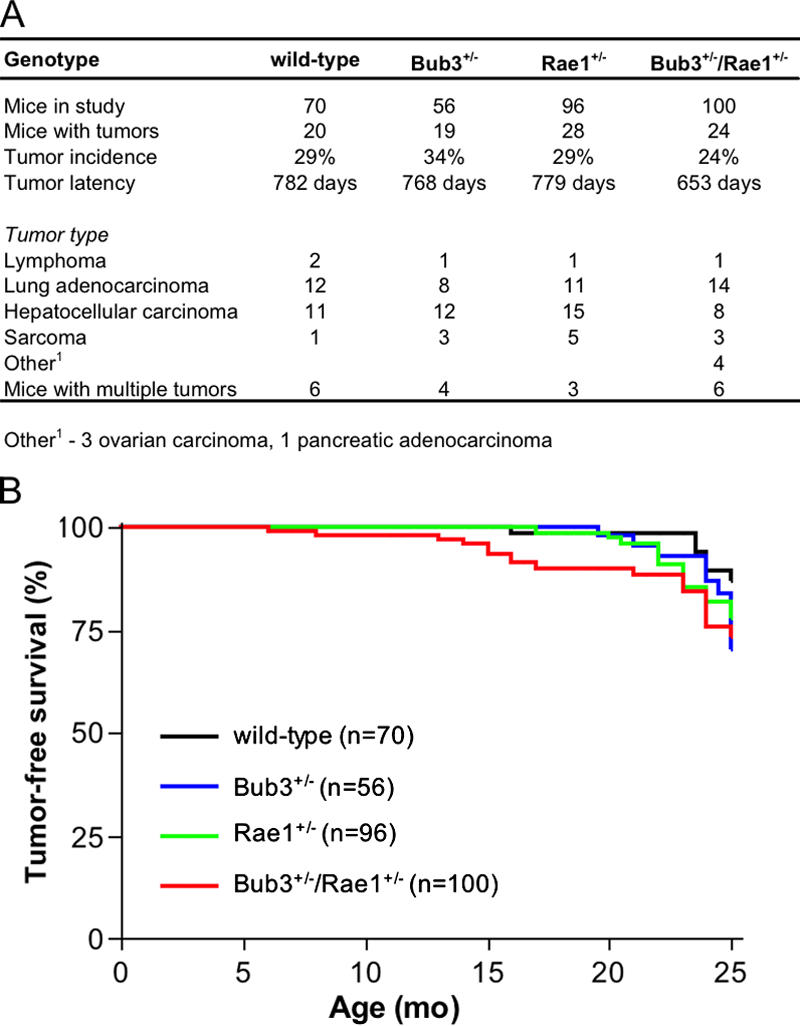
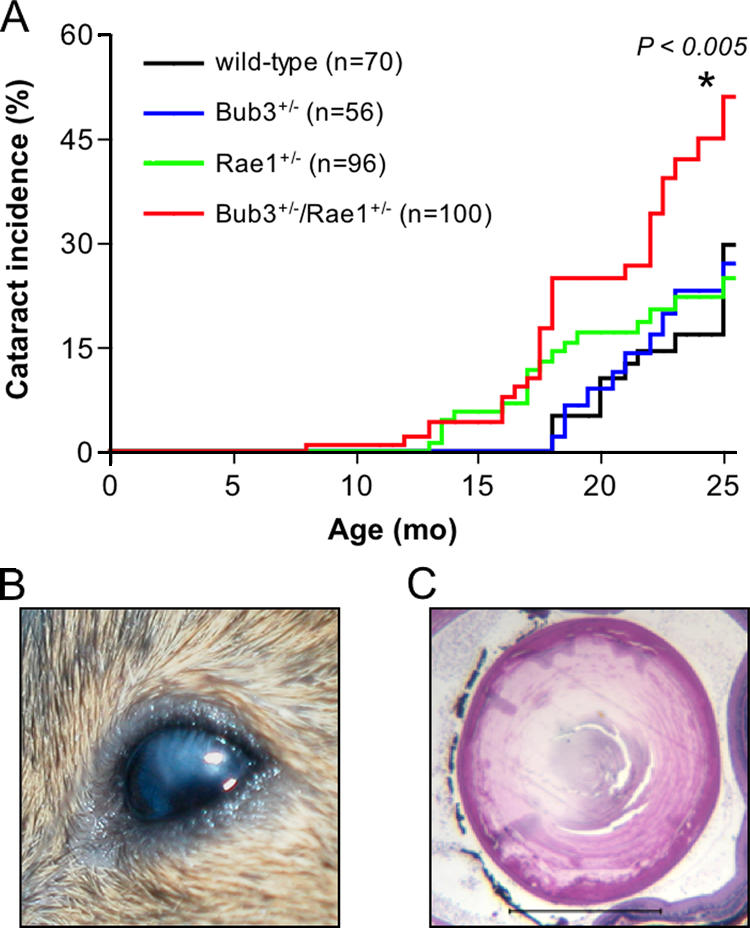
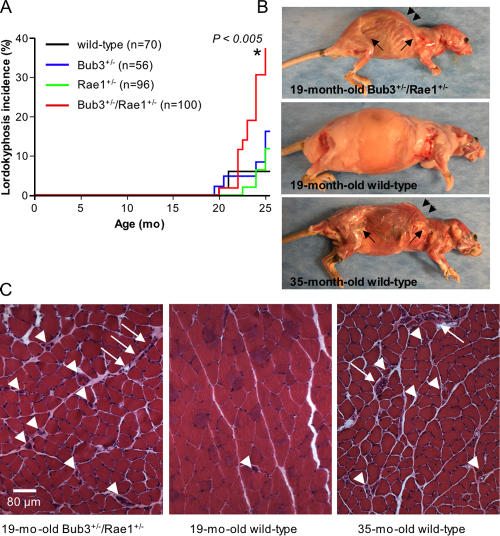
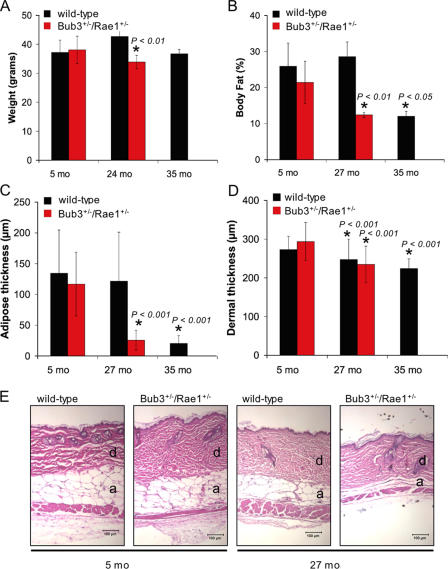
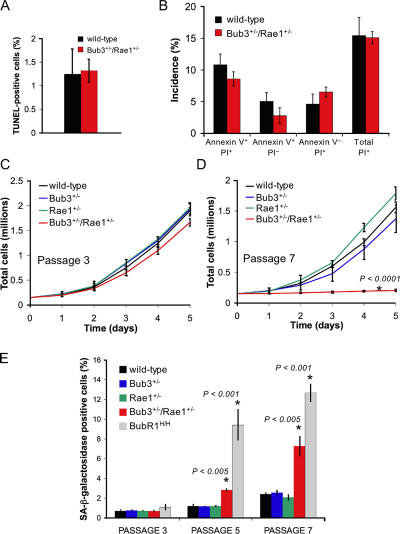
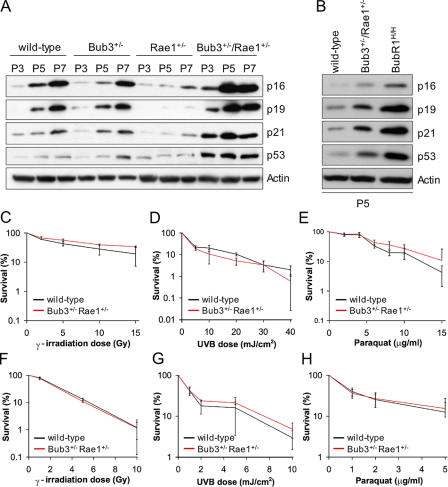
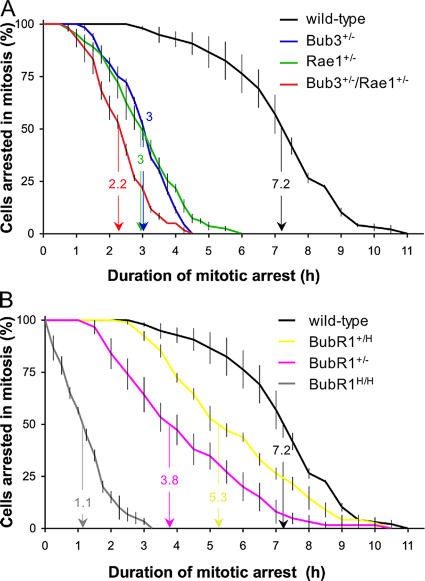
Aging is a highly complex biological process that is believed to involve multiple mechanisms. Mice that have small amounts of the mitotic checkpoint protein BubR1 age much faster than normal mice, but whether other mitotic checkpoint genes function to prevent the early onset of aging is unknown. In this study, we show that several aging-associated phenotypes appear early in mice that are double haploinsufficient for the mitotic checkpoint genes Bub3 and Rae1 but not in mice that are single haploinsufficient for these genes. Mouse embryonic fibroblasts (MEFs) from Bub3/Rae1 haploinsufficient mice undergo premature senescence and accumulate high levels of p19, p53, p21, and p16, whereas MEFs from single haploinsufficient mice do not. Furthermore, although BubR1 hypomorphic mice have less aneuploidy than Bub3/Rae1 haploinsufficient mice, they age much faster. Our findings suggest that early onset of aging-associated phenotypes in mice with mitotic checkpoint gene defects is linked to cellular senescence and activation of the p53 and p16 pathways rather than to aneuploidy.


Figures

Figure 1.
Figure 1.
Combined Bub3 and Rae1 haploinsufficiency reduces lifespan. (A–D) Representative photographs of wild-type and Bub3+/−/Rae1+/− mice at 5 (A and B) and 27 mo (C and D). These animals were not moribund at the time of the picture. Note the overt cataract, severe lordokyphosis, and cachetic appearance of the 27-mo-old Bub3+/−/Rae1+/− mouse pictured in D. (E) Overall survival curves for wild-type, Bub3+/−, Rae1+/−, and Bub3+/−/Rae1+/− mice. The curve marked with an asterisk is significantly different from that of wild-type mice using a log-rank test. We note that the lifespan of Bub3+/− and Rae1+/− mice is not statistically different from that of Bub3+/−/Rae1+/− mice.
Figure 2.
Figure 2.
Bub3+/−/Rae1+/− mice develop spontaneous tumors at normal rates despite severe aneuploidy. (A) Spontaneous tumor incidence, latency, and spectrum of wild-type and Bub3+/−/Rae1+/− mice. Upon biopsy of moribund animals, all tissues were screened for tumors. Tumorous tissues were collected and processed for histological evaluation. (B) Tumor-free survival curves of wild-type, Bub3+/−, Rae1+/−, and Bub3+/−/Rae1+/− mice.
Figure 3.
Figure 3.
Combined Bub3 and Rae1 haploinsufficiency accelerates cataract formation. (A) Cataract incidence of wild-type, Bub3+/−, Rae1+/−, and Bub3+/−/Rae1+/− mice as detected by the use of slit light after dilating the eyes. The asterisk indicates that the curve is statistically different from that of wild-type mice using a log-rank test. (B) Overt cataract detected in a 15-mo-old Bub3+/−/Rae1+/− mouse. (C) Cross section of a cataractous lens from a 15-mo-old Bub3+/−/Rae1+/− mouse stained with hematoxylin and eosin. Note that the posterior portion of the eye has Morgagnian globules, whereas the inner portion has profound calcification. Bar, 1 mm.
Figure 4.
Figure 4.
Lordokyphosis develops early in mice with combined Bub3 and Rae1 haploinsufficiency. (A) Incidence of lordokyphosis in wild-type, Bub3+/−, Rae1+/−, and Bub3+/−/Rae1+/− mice. The asterisk indicates that the curve is statistically different from that of wild-type mice using a log-rank test. (B) Skinned 19-mo-old Bub3+/−/Rae1+/−, 19-mo-old wild-type, and 35-mo-old wild-type mice. The Bub3+/−/Rae1+/− mouse and the 35-mo-old wild-type mouse exhibit lordokyphosis (arrowheads) and have little subcutaneous fat (arrows). (C) Cross section of gastrocnemius muscles of the animals shown in B. Arrowheads mark degenerated fibers, and arrows mark areas of fibroblast infiltration.
Figure 5.
Figure 5.
Early aging–related phenotypes of combined Bub3/Rae1 haploinsufficient mice. (A) Body weight analysis of wild-type and Bub3+/−/Rae1+/− male mice (n ≥ 4 male mice per genotype). Bub3+/−/Rae1+/− mice have normal body weights at 5 mo but significantly reduced body weights at 24 mo. We note that neither Bub3+/− nor Rae1+/− mice show this reduction (not depicted). The decrease in body weight between the 24- and 35-mo-old wild-type mice is not significant but does show a trend of reduction in body weight. (B) Graph showing total body fat content in wild-type and Bub3+/−/Rae1+/− mice at 5, 27, and 35 mo (n = 4 male mice per genotype at each age). (C) Graph showing subcutaneous adipose layer thickness of wild-type and Bub3+/−/Rae1+/− mice at 5 and 27 mo along with 35-mo-old wild-type mice. Note the reduced thickness in 27-mo-old Bub3+/−/Rae1+/− mice and 35-mo-old wild-type mice (n = 4 males per genotype). (D) Graph showing dermal thickness of wild-type and Bub3+/−/Rae1+/− mice at 5 and 27 mo along with 35-mo-old wild-type mice. (A–D) Error bars represent SD. Asterisks mark values that are significantly different from wild-type values using a Mann-Whitney test. (E) Representative hematoxylin and eosin–stained dorsal skin sections of 5- and 27-mo-old wild-type and Bub3+/−/Rae1+/− from which the data in C and D were collected. Dermis (d) and adipose layer (a) are indicated. Bars, 100 μm.
Figure 6.
Figure 6.
Early onset of cellular senescence in Bub3/Rae1 double haploinsufficient MEFs. (A) Analysis of the percentages of cell death in Bub3+/−/Rae1+/− and wild-type MEFs cultures by TUNEL assay (n = 3 MEF lines per genotype). (B) Percentages of Bub3+/−/Rae1+/− and wild-type MEFs that are in the early stages of apoptosis (annexin V+/PI cells), in the late stages of apoptosis, already dead (annexin V+/PI+ cells), that undergo nonapoptotic cell death (annexin V/PI+ cells), or that are dead (PI+ cells). We used 3 MEF lines per genotype. We note that the differences between Bub3+/−/Rae1+/− and wild-type MEFs were not statistically significant using an unpaired t test. (C and D) Growth curves of wild-type, Bub3+/−, Rae1+/−, and Bub3+/−/Rae1+/− MEF cells at P3 (C) and P7 (D). 1.5 × 10⁵ cells of indicated passages were seeded in duplicate on day 0 and counted for five consecutive days. Lines represent three independent MEF lines. Note that Bub3+/−/Rae1+/− MEF cells have reduced proliferation potential at P7, whereas single heterozygous Bub3+/− and Rae1+/− MEFs do not. (E) Percentages of wild-type, Bub3+/−, Rae1+/−, BubR1H/H, and Bub3+/−/Rae1+/− MEF cells that were positive for SA β-galactosidase activity at the indicated passages (n = 3 lines for each genotype at each passage). Asterisks in D and E mark values that are significantly different from those of wild-type mice using an unpaired t test. Error bars represent SD.
Figure 7.
Figure 7.
Bub3+/−/Rae1+/− MEFs have higher levels of SA molecular markers. (A) Western blot analysis of proteins in extracts from wild-type, Bub3+/−, Rae1+/−, and Bub3+/−/Rae1+/− MEFs at P3, P5, and P7. Blots were probed with antibodies against the indicated proteins. Note that the induction of senescence markers is delayed in Rae1+/− MEFs; this delay was consistently seen in three independent Rae1+/− MEF lines. (B) Western blots of protein extracts from P5 wild-type, Bub3+/−/Rae1+/−, and BubR1H/H MEFs probed with the indicated antibodies. The results shown in A and B are representative for three independently generated MEF lines of each genotype. (C–H) Analysis of the fidelity of distinct DNA damage repair pathways by measuring cell survival and colony formation ability after exposing early passage MEFs to various kinds of DNA-damaging agents. (C–E) Survival curves of wild-type and Bub3+/−/Rae1+/− MEFs after DNA damage by γ-irradiation (C), UV type B (D), or paraquat (E). (F–H) Colony-forming assay of wild-type and Bub3+/−/Rae1+/− MEFs after DNA damage by γ-irradiation (F), UV type B (G), or paraquat (H). Error bars represent SD.
Figure 8.
Figure 8.
Spindle assembly checkpoint activity analysis. (A) Analysis of mitotic checkpoint activity of wild-type, Bub3+/−, Rae1+/−, and Bub3+/−/Rae1+/− MEFs. MEF cultures were challenged with nocodazole, and cells undergoing NEBD were marked. We continued to monitor these cells at 15-min intervals until their chromosomes decondensed. The duration of arrest in mitosis was defined as the interval between NEBD (onset of mitosis) and chromatin decondensation (exit from mitosis without cytokinesis). The time at which 50% of the cells had exited mitosis has been indicated. This time was used as a measure for spindle assembly checkpoint activity. (B) Analysis of mitotic checkpoint activity of wild-type, BubR1+/H, BubR1+/−, and BubR1H/H MEFs. We note that BubR1+/H and BubR1+/− mice have a normal lifespan and lack early aging–associated phenotypes (Baker et al., 2004). Error bars represent SEM.

References

    1. Atadja, P., H. Wong, I. Garkavtsev, C. Veillette, and K. Riabowol. 1995. Increased activity of p53 in senescing fibroblasts. Proc. Natl. Acad. Sci. USA. 92:8348–8352. - PMC - PubMed
    1. Babu, J.R., K.B. Jeganathan, D.J. Baker, X. Wu, N. Kang-Decker, and J.M. van Deursen. 2003. Rae1 is an essential mitotic checkpoint regulator that cooperates with Bub3 to prevent chromosome missegregation. J. Cell Biol. 160:341–353. - PMC - PubMed
    1. Baker, D.J., K.B. Jeganathan, J.D. Cameron, M. Thompson, S. Juneja, A. Kopecka, R. Kumar, R.B. Jenkins, P.C. de Groen, P. Roche, and J.M. van Deursen. 2004. BubR1 insufficiency causes early onset of aging-associated phenotypes and infertility in mice. Nat. Genet. 36:744–749. - PubMed
    1. Baker, D.J., J. Chen, and J.M. van Deursen. 2005. The mitotic checkpoint in cancer and aging: what have mice taught us? Curr. Opin. Cell Biol. 17:583–589. - PubMed
    1. Bastos, R., A. Lin, M. Enarson, and B. Burke. 1996. Targeting and function in mRNA export of nuclear pore complex protein Nup153. J. Cell Biol. 134:1141–1156. - PMC - PubMed

Publication types

Substances