. 2006 Feb 13;172(4):541-52.
doi: 10.1083/jcb.200507101.

Nucleoplasmic beta-actin exists in a dynamic equilibrium between low-mobility polymeric species and rapidly diffusing populations

Affiliations

Nucleoplasmic beta-actin exists in a dynamic equilibrium between low-mobility polymeric species and rapidly diffusing populations

Darin McDonald et al. J Cell Biol. .

Abstract

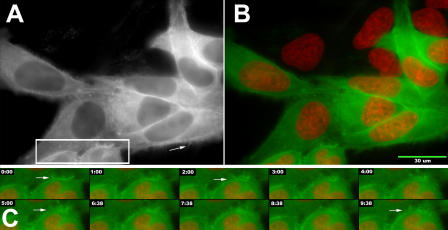
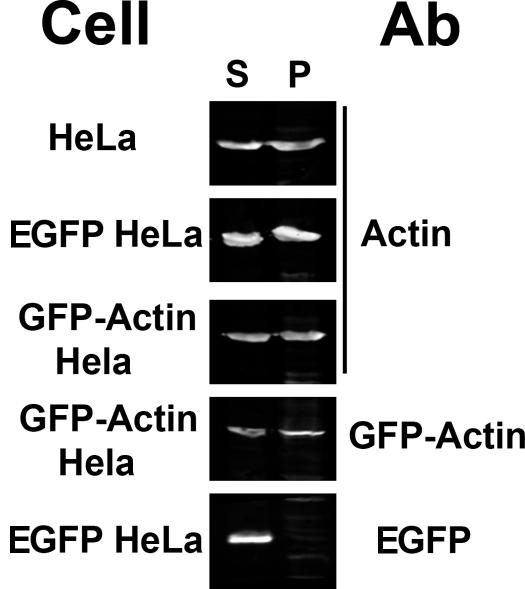
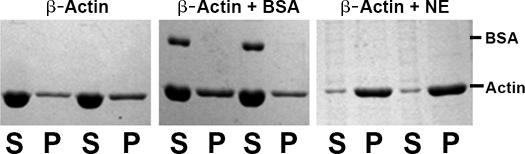
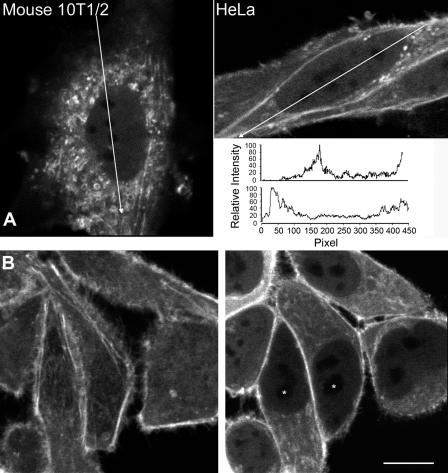
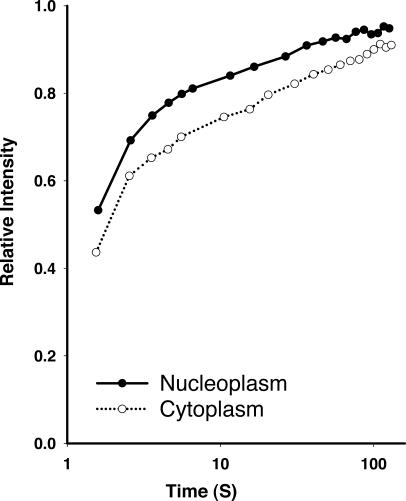
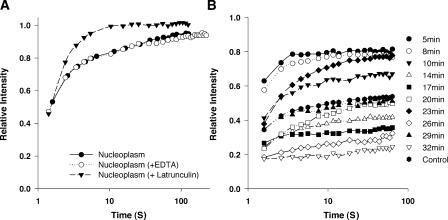
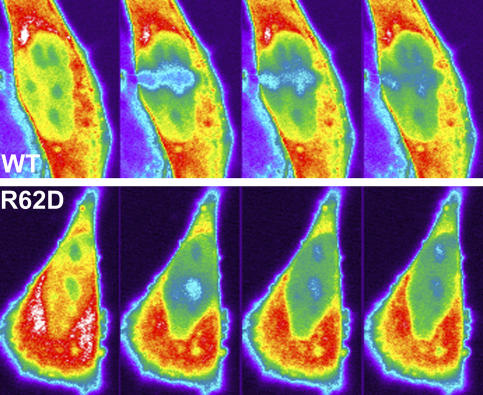
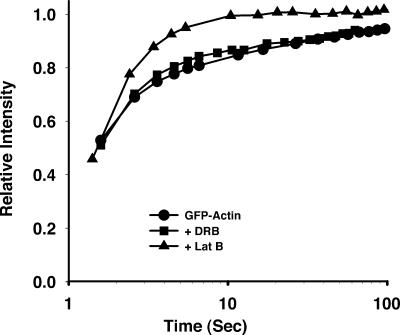
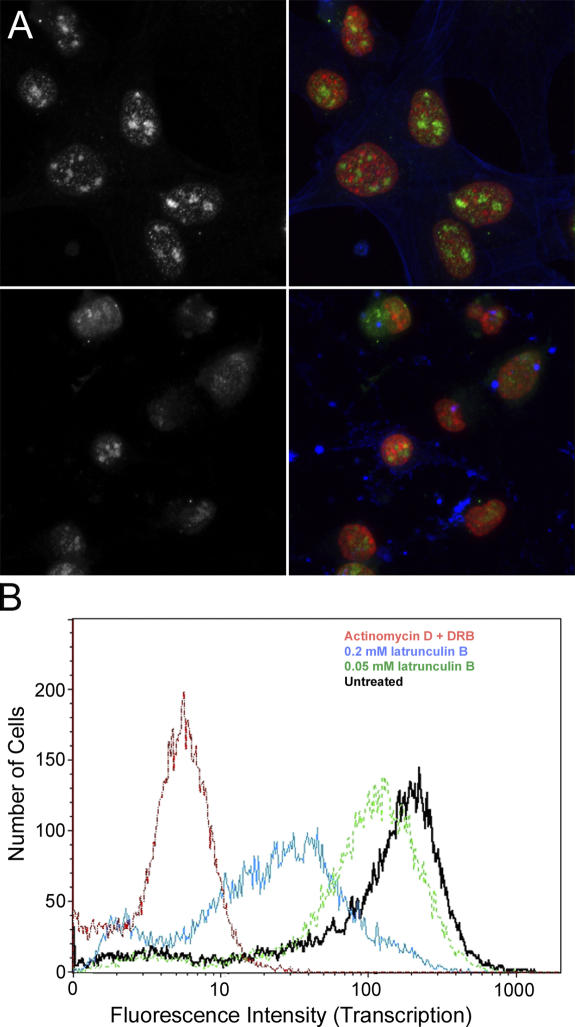
Beta-actin, once thought to be an exclusively cytoplasmic protein, is now known to have important functions within the nucleus. Nuclear beta-actin associates with and functions in chromatin remodeling complexes, ribonucleic acid polymerase complexes, and at least some ribonucleoproteins. Proteins involved in regulating actin polymerization are also found in the interphase nucleus. We define the dynamic properties of nuclear actin molecules using fluorescence recovery after photobleaching. Our results indicate that actin and actin-containing complexes are reduced in their mobility through the nucleoplasm diffusing at approximately 0.5 microm2 s(-1). We also observed that approximately 20% of the total nuclear actin pool has properties of polymeric actin that turns over rapidly. This pool could be detected in endogenous nuclear actin by using fluorescent polymeric actin binding proteins and was sensitive to drugs that alter actin polymerization. Our results validate previous reports of polymeric forms of nuclear actin observed in fixed specimens and reveal that these polymeric forms are very dynamic.


Figures

Figure 1.
Figure 1.
Dynamics of GFP-actin in living HeLa cells. HeLa cells that stably expressed the EGFP–β-actin construct were incubated with 1 μg/ml of Hoechst 33258 to fluorescently stain the nuclear chromatin and then imaged live by fluorescence microscopy. (A) The GFP image obtained at the onset of the time-lapse experiment. (B) A composite image where the DNA image (red) is superimposed on the GFP-actin image (green). The arrows indicate the positions of F-actin–dependent extensions from the cell surface that rapidly remodel throughout the time course (C).
Figure 2.
Figure 2.
Immunoblotting of cytosolic and cytoskeletal cellular fractions. HeLa cells were lysed in the presence of Triton X-100 to solubilize the cytosol (S). The polymerized actin remains in the cell pellet (P). HeLa cells, HeLa cells stably expressing GFP–β-actin, and HeLa cells stably expressing GFP were analyzed using this procedure. The SDS-soluble proteins were then electrophoresed on an 8% polyacrylamide–SDS gel, transferred, and developed using a fluorescently tagged antibody. Quantitative immunoblots were then collected using an Odyssey system (Li-Cor). The labels on the left indicate the types of cells used for the experiment, and the labels on the right indicate the antigen recognized by the antibody (Ab) used to develop the blot.
Figure 3.
Figure 3.
In vitro polymerization of actin in the presence of nuclear extract. Partially polymerized actin was incubated alone, in the presence of nuclear extract, or in the presence of BSA. After centrifugation, supernatant and pellet fractions were resolved by SDS-PAGE and visualized with Coomassie blue. Each reaction was performed in duplicate, and both samples were loaded onto the gel. S indicates the monomer population, whereas P indicates the polymerized population.
Figure 4.
Figure 4.
The distribution of GFP-actin in the living nucleus. (A) Mouse cells (left) or HeLa cells (right) stably expressing GFP–β-actin were examined by laser-scanning confocal microscopy. The lines drawn across the cells indicate the path of a 3-pixel-wide linescan, and the arrowhead indicates the direction of the linescan. The linescan is shown as pixel number versus intensity as a percentage of the maximum value obtained in the linescan. (B) Rhodamine-conjugated β-actin was microinjected into living HeLa cells. After equilibration of the microinjected fluorescent actin throughout the cell volume, laser-scanning confocal images were collected. (left) An image obtained from the uppermost surface of a group of microinjected HeLa cells. (right) An image obtained near the midplane of most of the cell nuclei. The asterisks show the position of the nucleoli. Bar, 10 μm.
Figure 5.
Figure 5.
Recovery of GFP-actin in the cytoplasmic and nuclear compartments. HeLa cells stably expressing GFP–β-actin were analyzed by FRAP. FRAP data was collected from cells where either the cytoplasm or the nucleoplasm was photobleached. The mean recovery profile is plotted versus recovery time. Time is plotted on a log scale to better illustrate both the rapid and the slow populations of molecules.
Figure 6.
Figure 6.
Recovery of nuclear actin in the presence and absence of an inhibitor of actin polymerization. The recovery kinetics of GFP-actin was quantified in stably transfected HeLa cells, HeLa cells that were treated with latrunculin A, and HeLa cells that were treated with EDTA. The relative intensity is plotted versus time, with time plotted on a log scale.
Figure 7.
Figure 7.
Recovery of an actin mutant unable to incorporate into filaments. Photobleaching experiment performed using cells transiently transfected with wild type GFP-actin (WT) or actin containing a point mutation at amino acid 62 (R62D). From left to right, the images represent prebleach, 1.5 s postbleach, 5 s postbleach, and 10 s postbleach. Dark colors represent lower concentrations of GFP, whereas bright colors represent higher concentrations, with white being the most concentrated. The bottom panel shows the FRAP recovery profiles of GFP-actin, GFP-actin + latrunculin, and the R62D actin mutant.
Figure 8.
Figure 8.
FRAP recovery curve of EGFP–β-actin in the presence of transcriptional inhibitors. The recovery kinetics of GFP-actin was quantified in stably transfected HeLa cells and HeLa cells that were treated with the RNA polymerase II transcription inhibitor, DRB, for 4 h before performing the FRAP experiment. The results obtained with latrunculin B are shown for comparison.
Figure 9.
Figure 9.
Transcriptional activity in the presence of latrunculin. (A) The immunofluorescence images show 5-fluorouridine incorporation (left and right, green) in mouse 10T1/2 cells without (top) or with (bottom) pretreatment for 60 min with latrunculin. The corresponding color composite images show 5-fluorouridine (green), DAPI (red), and Alexa 546 phalloidin (blue). (B) Flow cytometry profiles of cells treated with DRB and actinomycin D (red line), 0.2 mM latrunculin B (blue line), or 0.05 mM latrunculin B (green line) or left untreated (black line).

Comment in

References

    1. Albuquerque, M.L., and A.S. Flozak. 2001. Patterns of living beta-actin movement in wounded human coronary artery endothelial cells exposed to shear stress. Exp. Cell Res. 270:223–234. - PubMed
    1. Amankwah, K.S., and U. De Boni. 1994. Ultrastructural localization of filamentous actin within neuronal interphase nuclei in situ. Exp. Cell Res. 210:315–325. - PubMed
    1. Amato, P.A., and D.L. Taylor. 1986. Probing the mechanism of incorporation of fluorescently labeled actin into stress fibers. J. Cell Biol. 102:1074–1084. - PMC - PubMed
    1. Andrin, C., and M.J. Hendzel. 2004. F-actin-dependent insolubility of chromatin-modifying components. J. Biol. Chem. 279:25017–25023. - PubMed
    1. Archer, S.K., C. Claudianos, and H.D. Campbell. 2005. Evolution of the gelsolin family of actin-binding proteins as novel transcriptional coactivators. Bioessays. 27:388–396. - PubMed

Publication types