

Normal macular thickness measurements in healthy eyes using Stratus optical coherence tomography
- PMID: 16476888
- PMCID: PMC1941772
- DOI: 10.1001/archopht.124.2.193
Normal macular thickness measurements in healthy eyes using Stratus optical coherence tomography
Abstract
Objective: To report normal macular thickness measurements in healthy eyes using the latest commercially available optical coherence tomography (OCT) mapping software, version 3.0, from the Stratus OCT (OCT3).
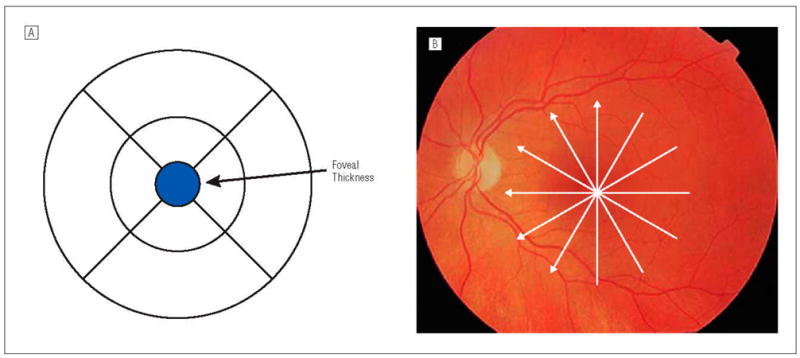
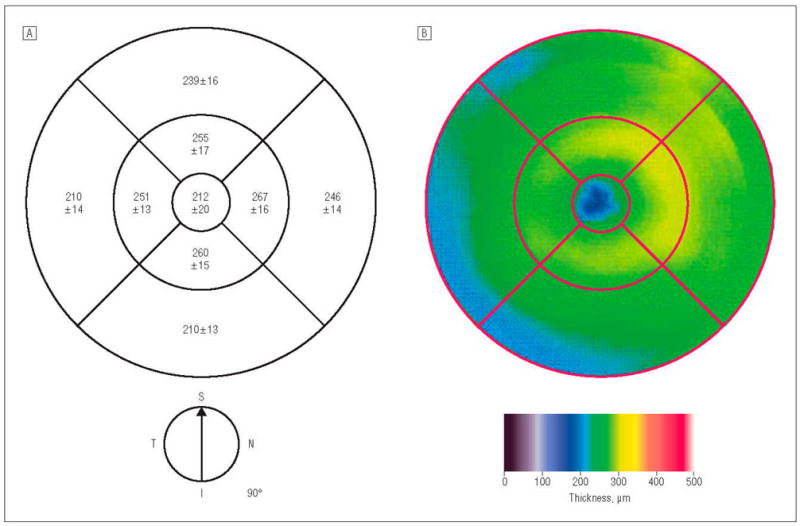
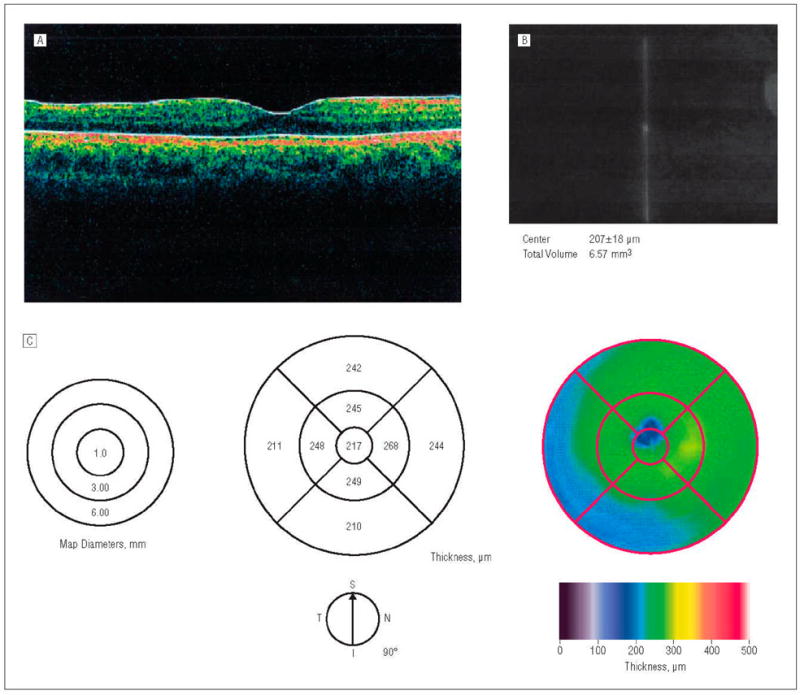
Methods: Thirty-seven eyes from 37 healthy subjects underwent a complete ophthalmologic examination, including OCT. Six radial scans, 6 mm in length and centered on the fovea, were obtained using the OCT3. Retinal thickness was automatically calculated by OCT mapping software. Measurements were displayed as the mean and standard deviation for each of the 9 regions defined in the Early Treatment Diabetic Retinopathy Study.
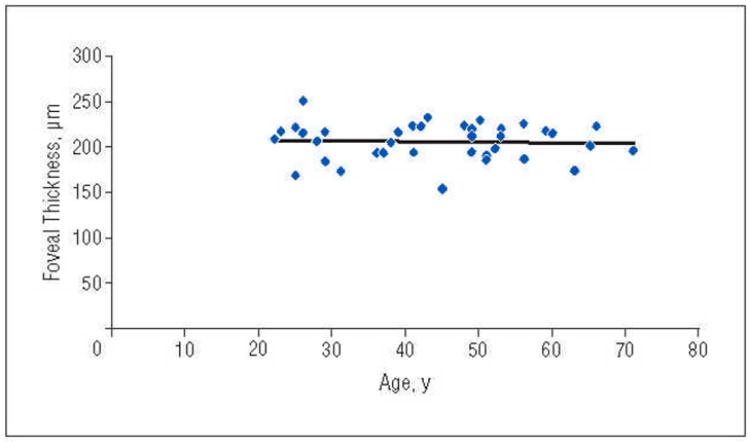
Results: Foveal thickness (mean thickness in the central 1000-microm diameter area) and central foveal thickness (mean thickness at the point of intersection of 6 radial scans) on the OCT3 were 212 +/- 20 and 182 +/- 23 microm, respectively. Macular thickness measurements were thinnest at the center of the fovea, thickest within 3-mm diameter of the center, and diminished toward the periphery of the macula. The temporal quadrant was thinner than the nasal quadrant. Central foveal thickness was also manually determined as 170 +/- 18 microm, approximately 12 microm less than the value automatically obtained from the OCT3 software. There was no correlation between age and foveal thickness (P = .80).
Conclusions: Mean foveal thickness measurements were 38 to 62 microm thicker than previously reported values, while mean central foveal thickness measurements were 20 to 49 microm thicker than previously published values. This discrepancy should be considered when interpreting OCT scans.
Figures
References
-
- Stark WJ, Maumenee AE, Fagadau W, et al. Cystoid macular edema in pseudophakia. Surv Ophthalmol. 1984;28:442–451. - PubMed
-
- Nussenblatt RB, Kaufman SC, Palestine AG, et al. Macular thickening and visual acuity: measurements in patients with cystoid macular edema. Ophthalmology. 1987;94:1134–1139. - PubMed
-
- Shahidi M, Ogura Y, Blair NP, et al. Retinal thickness analysis for quantitative assessment of diabetic macular edema. Arch Ophthalmol. 1991;109:1115–1119. - PubMed
MeSH terms
Grants and funding
LinkOut - more resources
Full Text Sources
Other Literature Sources
