Automated cell lineage tracing in Caenorhabditis elegans
- PMID: 16477039
- PMCID: PMC1413828
- DOI: 10.1073/pnas.0511111103
Automated cell lineage tracing in Caenorhabditis elegans
Abstract
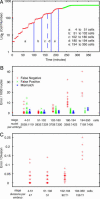
The invariant cell lineage and cell fate of Caenorhabditis elegans provide a unique opportunity to decode the molecular mechanisms of animal development. To exploit this opportunity, we have developed a system for automated cell lineage tracing during C. elegans embryogenesis, based on 3D, time-lapse imaging and automated image analysis. Using ubiquitously expressed histone-GFP fusion protein to label cells/nuclei and a confocal microscope, the imaging protocol captures embryogenesis at high spatial (31 planes at 1 microm apart) and temporal (every minute) resolution without apparent effects on development. A set of image analysis algorithms then automatically recognizes cells at each time point, tracks cell movements, divisions and deaths over time and assigns cell identities based on the canonical naming scheme. Starting from the four-cell stage (or earlier), our software, named starrynite, can trace the lineage up to the 350-cell stage in 25 min on a desktop computer. The few errors of automated lineaging can then be corrected in a few hours with a graphic interface that allows easy navigation of the images and the reported lineage tree. The system can be used to characterize lineage phenotypes of genes and/or extended to determine gene expression patterns in a living embryo at the single-cell level. We envision that this automation will make it practical to systematically decipher the developmental genes and pathways encoded in the genome of C. elegans.
Conflict of interest statement
Conflict of interest statement: No conflicts declared.
Figures


References
-
- Sulston J. E., Schierenberg E., White J. G., Thomson J. N. Dev. Biol. 1983;100:64–119. - PubMed
-
- White J., Southgate E., Thomson J. N., Brenner S. Phil. Trans. R. Soc. London Ser. B. 1986;314:1–340. - PubMed
-
- Caenorhabditis elegans Sequencing Consortium Science. 1998;282:2012–2018. - PubMed
-
- Hedgecock E. M., Sulston J. E., Thomson J. N. Science. 1983;220:1277–1279. - PubMed
-
- Sulston J. E. Philos. Trans. R. Soc. London B. 1976;275:287–297. - PubMed
Publication types
MeSH terms
Substances
LinkOut - more resources
Full Text Sources
Other Literature Sources
Molecular Biology Databases

