. 2006 Feb;2(2):e17.
doi: 10.1371/journal.pgen.0020017. Epub 2006 Feb 10.

Permissive transcriptional activity at the centromere through pockets of DNA hypomethylation

Affiliations

Permissive transcriptional activity at the centromere through pockets of DNA hypomethylation

Nicholas C Wong et al. PLoS Genet. 2006 Feb.

Abstract

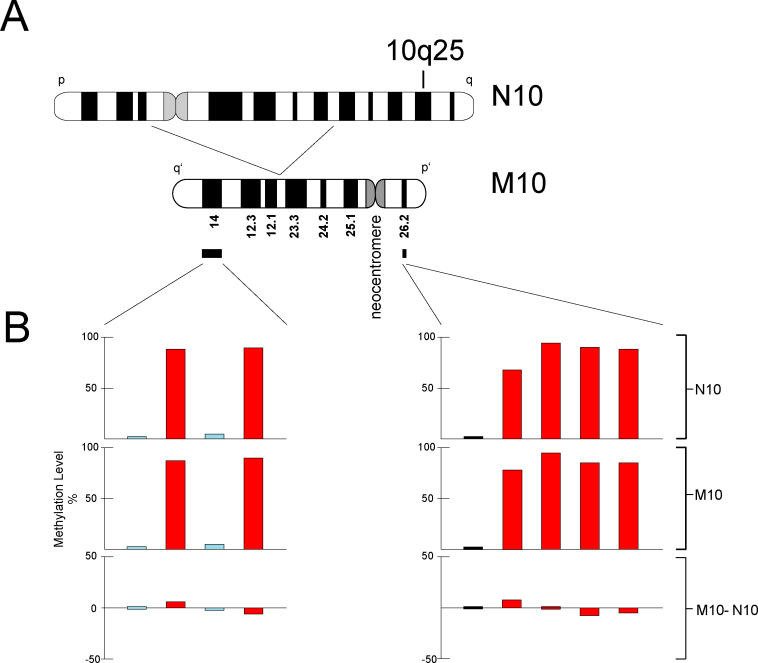
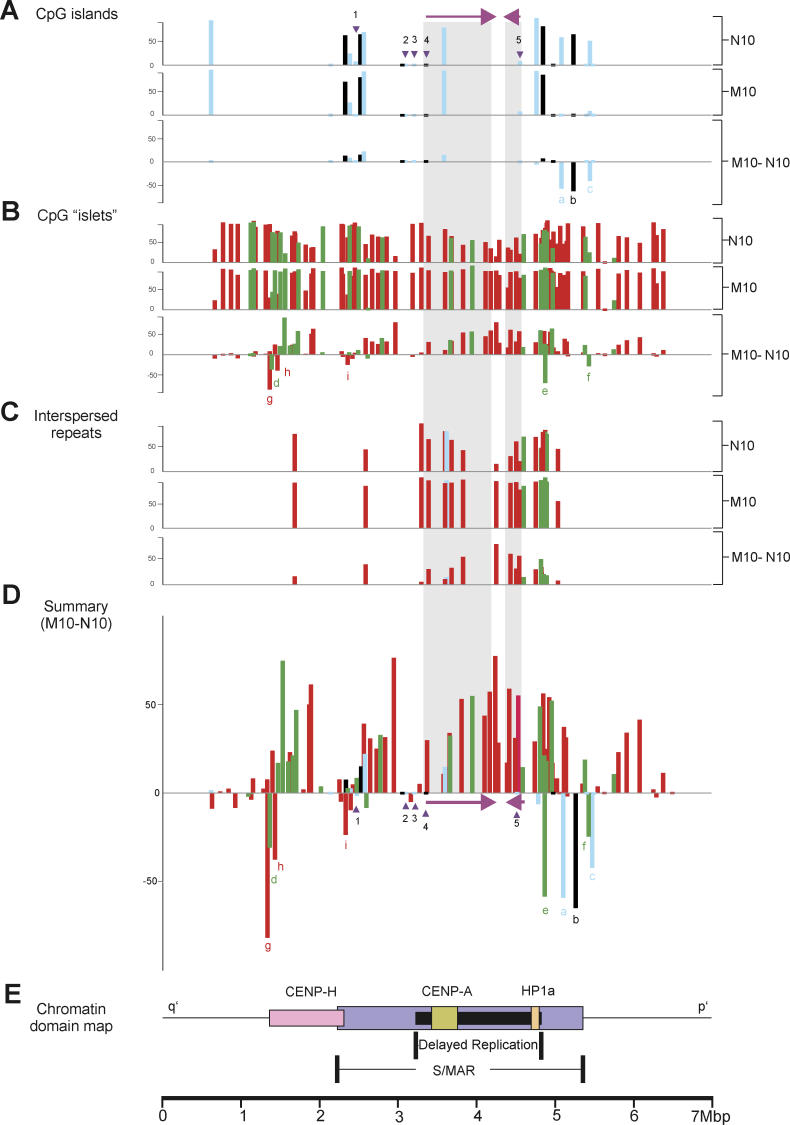
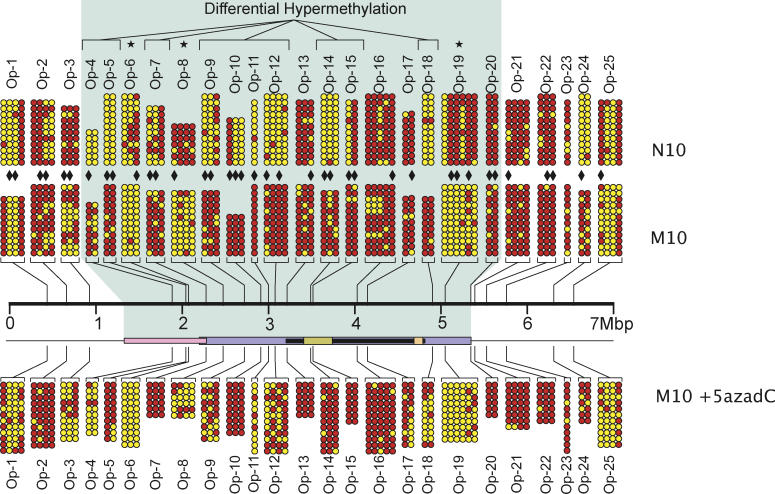
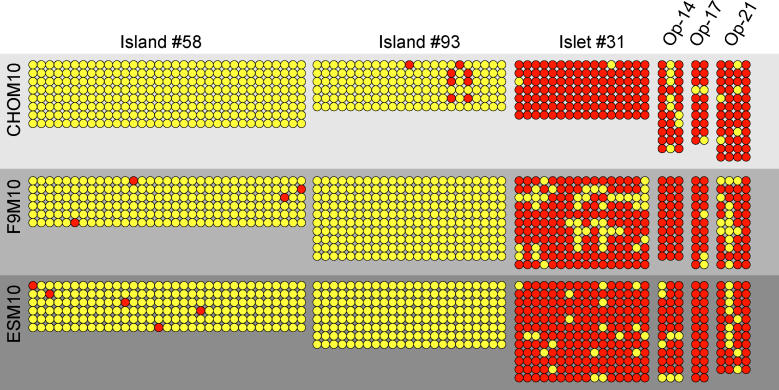
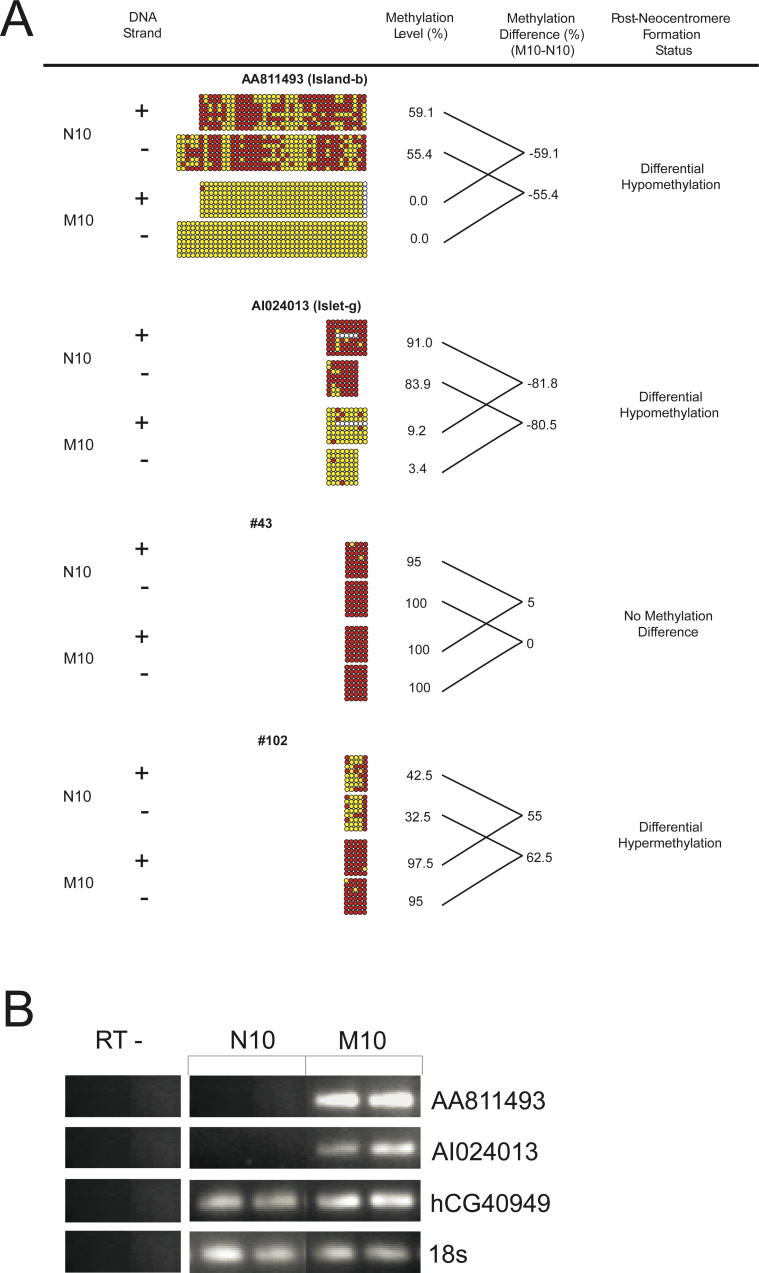
DNA methylation is a hallmark of transcriptional silencing, yet transcription has been reported at the centromere. To address this apparent paradox, we employed a fully sequence-defined ectopic human centromere (or neocentromere) to investigate the relationship between DNA methylation and transcription. We used sodium bisulfite PCR and sequencing to determine the methylation status of 2,041 CpG dinucleotides distributed across a 6.76-Mbp chromosomal region containing a neocentromere. These CpG dinucleotides were associated with conventional and nonconventional CpG islands. We found an overall hypermethylation of the neocentric DNA at nonconventional CpG islands that we designated as CpG islets and CpG orphans. The observed hypermethylation was consistent with the presence of a presumed transcriptionally silent chromatin state at the neocentromere. Within this neocentric chromatin, specific sites of active transcription and the centromeric chromatin boundary are defined by DNA hypomethylation. Our data demonstrate, for the first time to our knowledge, a correlation between DNA methylation and centromere formation in mammals, and that transcription and "chromatin-boundary activity" are permissible at the centromere through the selective hypomethylation of pockets of sequences without compromising the overall silent chromatin state and function of the centromere.


Conflict of interest statement

Competing interests. The authors have declared that no competing interests exist.

Figures

Figure 1
Figure 1. The 10q25 Locus and Control Regions Used in This Study
(A) Chromosome ideogram representing the derivation of the M10 chromosome containing the neocentromere formed at the 10q25 band. CpG islands and CpG islets selected from the p14 and q26.2 bands situated 39 and 7 Mbp from the neocentric sites, respectively, were measured for methylation in both N10 and M10 cell lines. (B) The level of methylation is shown for the same CpG islands and CpG islets in N10 and M10, and for their differences (M10 minus N10). CpG islands of >500 bp are represented by black bars; CpG islands of >200 bp and <500 bp are represented by light-blue bars; and CpG islets are represented by red bars.
Figure 2
Figure 2. DNA-Methylation Profiles for 129 Separate CpG Islands and Islets
Profiles apply across a 6.76-Mbp DNA section of the 10q25 region before (N10) and after (M10) neocentromere formation. The y-axis shows the percentage methylation in CHO–N10 and CHO–M10, and the percentage methylation difference (CHO–M10 minus CHO–N10). (A) Classically defined CpG islands [15] are represented by blue bars, while CpG islands conforming to the modern definition [22] are identified by black bars. Genes previously shown to be expressed in both CHO–N10 and CHO–M10 and known to be associated with a 5′ CpG island are labeled (1) FLJ10188, (2) KIAA1600, (3) TRUB1, (4) ATRNL1, and (5) GFRA1, with the position of their 5′-associated CpG islands indicated by inverted triangles, and the direction of transcription and the full extent of the two larger genes (4 and 5) indicated by the horizontal arrows and shaded areas, respectively. (B) CpG islets analyzed in this study with lengths ranging from 100 to 200 bp (green bars) or 50–99 bp (red bars). (C) Methylation levels of CpG islets identified as retrotransposable and other interspersed repetitive elements analyzed in this study. The full extent of the two larger genes (4 and 5) is indicated by the shaded areas. The length of CpG islets ranges from 100 to 200 bp (green bars) or 50–99 bp (red bars). (D) Summary of percentage methylation difference between CHO–M10 and CHO–N10. Three CpG islands and six CpG islets that are hypomethylated in M10 compared to N10 are denoted by a–i. (E) Relative positions of previously described chromatin domains corresponding to foundation centromeric proteins CENP-H and CENP-A, heterochromatin protein HP-1α, and enhanced S/MAR regions [32], and a region of delayed DNA replication [30].
Figure 3
Figure 3. Methylation Analysis of CpG Orphans
A total of 75 CpG orphans were selected from 25 sites (Op-1 to Op-25). Red circles denote methylated CpG dinucleotides, and yellow circles denote unmethylated CpG dinucleotides. The positions of Op-1 to Op-25 sites with respect to the previously defined centromeric chromatin domains (shaded area) are indicated (refer to Figure 2E for details). Sites showing differential hypermethylation following neocentromere formation are labeled on top. Sites showing differential hypomethylation are denoted by asterisks. CpG dinucleotides that are putative MeCP2-binding sites are indicated by solid diamonds. Upon treatment with 5-aza-dC, a number of CpG orphans (Op-4, Op-9, Op-11, Op-12, Op-17, and Op-18) demonstrated a significant decrease in DNA methylation.
Figure 4
Figure 4. Determination of Possible Variation in DNA-Methylation Pattern owing to Cell-Line Differences
The neocentromere-containing M10 chromosome was initially studied in a CHO hybrid cell background but was transferred to a mouse F9 and mouse ES cell line for further testing. DNA methylation was assessed on a selected number of CpG island, islets, and orphans that showed different DNA-methylation levels in the initial assay in CHO. The results indicated no significant difference in methylation levels in all three cell backgrounds.
Figure 5
Figure 5. DNA Strand-Bias Analysis
Four sequences were chosen for this analysis. (A) The EST-associated CpG island (AA811493; island b in Figure 2A and 2D), the EST-associated CpG islet (AI024013; islet g in Figure 2B and 2D), and two additional islets designated as numbers 43 and 102, respectively (see Tables S2, S3, and S5). Individual CpG dinucleotides are shown as columns. Red and yellow circles denote a methylated and unmethylated CpG dinucleotide, respectively. A very small number of undetermined sites are indicated by white circles. The aligned columns represent the same CpG dinucleotide from both strands. The methylation level was calculated as described in Materials and Methods. (B) RT-PCR analysis of an EST-associated CpG island (AA811493) and islet (AI024013). Positive controls were the 18S RNA standard and TRUB1 (corresponding to gene 3 in Figure 2A), which has previously been shown to be expressed in both CHO–N10 and CHO–M10 [32]. RT− indicates control lanes showing no DNA contamination from RNA prepared for this analysis.
Figure 6
Figure 6. Anaphase Analysis of CHO–M10
Cells were treated with 20 μM 5-aza-dC for a period of 3 d. (A) An untreated control cell undergoing normal anaphase, hybridized with M10-specific FISH probe to show correctly segregated M10 neocentromere (blue-green, filled arrowheads). (B and C) 5-aza-dC–treated anaphase cells showing lagging or bridging chromosome (open arrowhead) and the location of the correctly segregated M10 neocentromeres (green, filled arrowheads). (D) Anaphase cell with multiple lagging chromosomes (open arrowheads) and correctly segregated M10 (green, filled arrowheads). (E) Anaphase cell with a lagging M10 chromosome (open arrowhead). The M10 neocentromere probe is shown in green (filled arrowhead). Scale bar denotes 5 μm.
Figure 7
Figure 7. Effects of 20 μM 5-aza-dC Treatment on the 10q25 Neocentromere
(A) Inhibition of DNA methylation with 5-aza-dC increases centromere instability as demonstrated by a significant increase in the proportion of anaphase cells containing lagging or bridging chromosomes when compared with non-drug-treated PBS control Asterisk indicates p < 0.001, χ2-test. (B) Fluorescence-intensity ratio of chromatin proteins at the M10 neocentromere before and after 5-aza-dC treatment. The amount of 5MeC and MBD1, indicators of DNA methylation, was significantly reduced at the 10q25 neocentromere after 5-aza-dC. The histone modification, 3MeK9H3, associated with methylated DNA, also showed a significant reduction after 5-aza-dC treatment. Penta-acetylated H4, a histone modification associated with euchromatin, and constitutive centromeric protein A (CENP-A) were not significantly altered after 5-aza-dC treatment (mean raw fluorescence values are presented in Table S6). Single asterisk denotes p = 0.014, and double asterisks denote p < 0.001 in a Fisher's Exact t-test, with error bars representing standard errors of the mean. (C) Determination of DNA-methylation level of eight CpG islets and two islands at the 10q25 neocentromere following 5-aza-dC treatment. Six CpG islets (28, 31, 69, 70, 71, and 101) showed an increase in DNA methylation upon the formation of the 10q25 neocentromere. However, following 5-aza-dC treatment, the methylation level of these CpG islets decreased significantly. The locations of the eight CpG islets and two CpG islands (numbers 93 and 116) with respect to the mapped centromere domains are depicted on the scale bar. The numbers for the CpG islands and islets correspond to those shown in Tables S2, S3, and S5.

Similar articles

Cited by

References

    1. Choo KHA. Domain organization at the centromere and neocentromere. Dev Cell. 2001;1:165–177. - PubMed
    1. Pidoux AL, Allshire RC. Kinetochore and heterochromatin domains of the fission yeast centromere. Chromosome Res. 2004;12:521–534. - PubMed
    1. Amor DJ, Kalitsis P, Sumer H, Choo KHA. Building the centromere: From foundation proteins to 3D organization. Trends Cell Biol. 2004;14:359–368. - PubMed
    1. Cleveland DW, Mao Y, Sullivan KF. Centromeres and kinetochores: From epigenetics to mitotic checkpoint signaling. Cell. 2003;112:407–421. - PubMed
    1. Craig JM, Earle E, Canham P, Wong LH, Anderson M, et al. Analysis of mammalian proteins involved in chromatin modification reveals new metaphase centromeric proteins and distinct chromosomal distribution patterns. Hum Mol Genet. 2003;12:3109–3121. - PubMed

Publication types