. 2006 Mar;26(5):1589-97.
doi: 10.1128/MCB.26.5.1589-1597.2006.

A CTCF-dependent silencer located in the differentially methylated area may regulate expression of a housekeeping gene overlapping a tissue-specific gene domain

Affiliations

A CTCF-dependent silencer located in the differentially methylated area may regulate expression of a housekeeping gene overlapping a tissue-specific gene domain

Denis Klochkov et al. Mol Cell Biol. 2006 Mar.

Abstract

The tissue-specific chicken alpha-globin gene domain represents one of the paradigms, in terms of its constitutively open chromatin conformation and the location of several regulatory elements within the neighboring housekeeping gene. Here, we show that an 0.2-kb DNA fragment located approximately 4 kb upstream to the chicken alpha-globin gene cluster contains a binding site for the multifunctional protein factor CTCF and possesses silencer activity which depends on CTCF binding, as demonstrated by site-directed mutagenesis of the CTCF recognition sequence. CTCF was found to be associated with this recognition site in erythroid cells but not in lymphoid cells where the site is methylated. A functional promoter directing the transcription of the apparently housekeeping ggPRX gene was found 120 bp from the CTCF-dependent silencer. The data are discussed in terms of the hypothesis that the CTCF-dependent silencer stabilizes the level of ggPRX gene transcription in erythroid cells where the promoter of this gene may be influenced by positive cis-regulatory signals activating alpha-globin gene transcription.


Figures

FIG. 1.
FIG. 1.
(A) Schematic representation of the chicken α-globin domain with regulatory and structural elements. Globin genes and regions of homology with exons of the human gene “-14” are shown by filled rectangles. The open rectangle shows the position of the CpG island (33), which includes a weak enhancer (34) and an origin of bidirectional DNA replication (35, 45). Directions of replication are shown below by horizontal arrows. The filled triangle shows the position of a strong erythroid cell-specific enhancer (25) and silencer (38). DNase I-hypersensitive sites (DHs) are shown by arrows (15, 20, 31, 43); closed arrows represent erythroid cell-specific DHs; thin arrows show DHs in promoter regions; open arrows show constitutive DHs. (B) The putative CTCF-binding site (50 bp) located within the 200-bp SmaI fragment. The arrow indicates the direction of ggPRX gene transcription. The regions critical for CTCF binding deduced from alignment of the putative CTCF-binding site with the FII sequence (CTCF) recognition site from the chicken β-globin domain 5′ HS4 insulator (2) are shown in boldface type. The numbers defining the two SmaI sites correspond to GenBank sequence AF098919, and the numbers in brackets show their positions relative to the start of π gene transcription.
FIG. 2.
FIG. 2.
CTCF interacts in vitro with the downstream part of the CpG island from the 5′ extended area of the chicken α-globin gene domain. (A) Electrophoretic mobility shift assay using nuclear extracts from HD3 cells. Note that the retarded complex was competed by a 10-fold molar excess of unlabeled FII DNA. (B) Western blot with CTCF-specific antibodies showing endogenous chicken CTCF in nuclear extracts of HD3 cells and overexpressed chicken CTCF in COS-1 cells transfected with a pSG5-CTCF vector. (C) Gel shift experiment with nuclear extract from HD3 cells or from COS-1 cells overexpressing chicken CTCF.
FIG. 3.
FIG. 3.
Methylation interferes with CTCF binding to the recognition sequence under study. Gel retardation experiments with a radiolabeled 50-bp fragment containing the putative CTCF-binding site either nonmethylated (C), fully methylated at all five CpGs (FM), or methylated at individual CpGs (M1 to M5). Nuclear protein extract (NPE) from HD3 cells was added to all reaction mixtures, except that shown in lane 1. In lane 3, a 10-fold molar excess of specific inhibitor (FII unlabeled DNA) was present in the reaction mixture along with poly(dI-dC) (note that the upper band was specifically competed). The sequence of the putative CTCF recognition site is presented below with the positions of CpG dinucleotides (M1 to M5) that were either totally or individually methylated.
FIG. 4.
FIG. 4.
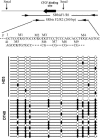
Methylation status of the CTCF-binding site in erythroid and nonerythroid cell lines. Genomic DNA from HD3 and DT40 cells was bisulfite treated and amplified in a nested reaction with the primers SRbisF1 plus SRbisR1 and SRbisF2 plus SRbisR2 (see the scheme at the top of the figure). The amplified fragment covered a 200-bp region, which included the five CpG dinucleotides of the CTCF-binding site plus four downstream CpGs (labeled in boldface type). The amplified DNA fragment was cloned and sequenced as described in Materials and Methods. The results of bisulfite sequencing (analysis of 14 clones in each case) are shown at the bottom of the figure. Methylated and unmethylated CpGs are shown as filled or open circles, respectively.
FIG. 5.
FIG. 5.
In vivo interaction of CTCF with the recognition site within the chicken α-globin gene domain upstream CpG island. DNA was recovered from the immunoprecipitate after ChIP using chicken CTCF-specific antibodies (44) or preimmune serum (PI). (A) PCR amplification of the 200-bp region with the CTCF-binding site using DNA from ChIP with PI or with CTCF-specific antibodies (CTCF) from 6C2, HD3, and DT40 cells. (B) PCR amplification of the βA/ɛ enhancer using DNA from ChIP with PI or with CTCF from HD3 and DT40 cells. (C) Linear dependence of PCR product on the quantity of template used. All data are representative of two independent experiments and at least three independent PCR amplifications in the linear range.
FIG. 6.
FIG. 6.
Analysis of enhancer-blocking and silencing activity of the 200-bp CTCF-binding fragment by transient transfection of linearized (A) or circular (B) plasmids into HD3 cells. Constructs are shown on the left and CAT activity is shown on the right. The chicken adult β-globin promoter (gray boxes) and a minimal βA/ɛ enhancer (black boxes) were used to control expression of the reporter CAT gene (construct 1). As a negative control, the same construct with a deleted βA/ɛ enhancer (construct 2) was used. The 200-bp DNA fragment (white boxes) was cloned in the SalI or HindIII sites of pAcatE in different orientations (indicated by arrows showing the direction of α-globin gene transcription). The filled circle inside the 200-bp fragment indicates the approximate position of the CTCF-binding site. CAT activity was normalized considering the efficiency of transfection. Error bars show the standard error of the mean (SEM) from three independent experiments.
FIG. 7.
FIG. 7.
Dependence of the silencing activity of the 200-bp fragment on CTCF binding. (A) Putative CTCF-binding sequence with regions believed to be critical for binding underlined (a); mutated fragment with two of the three regions partially deleted (b). (B) CTCF binding to the 200-bp native (N) and mutated (Mut) fragment in a gel retardation assay. (C) Silencing activity of the native 200-bp DNA fragment (construct b) and of the fragment with a mutated CTCF-binding site (construct c). The βA/ɛ enhancer activity, calculated as the difference between the activities displayed by the pAcatE construct (construct a) and by the construct with a deleted βA/ɛ enhancer, was taken as 100%. All the constructs were linearized before transfection into HD3 cells. Error bars show the SEM of three independent experiments.
FIG. 8.
FIG. 8.
Dependence of the silencing activity on the distance between the CTCF-binding site and the enhancer. The constructs are shown on the left; the 200-bp SmaI fragment under study is shown by the open box containing a filled circle showing the approximate position of the CTCF-binding site. The DNA fragments inserted between the βA/ɛ enhancer and the 200-bp fragment are shown by hatched boxes. Enhancer activity is presented as shown in Fig. 7.
FIG. 9.
FIG. 9.
Identification of the chicken ggPRX gene promoter. (A) Alignment of the nucleotide sequences of the human -14 gene promoter region (numbers correspond to GenBank sequence AE006462) and of the CpG island from the upstream region of the chicken α-globin domain (numbers correspond to GenBank sequence AF098919). The regions sharing sequence identity are shaded. (B) Transient transfection experiments in HD3 cells (left) and HeLa cells (right); the constructs are shown on the far left and CAT activity is shown on the right. As a negative control, the promoterless pCAT3 basic vector (Promega) was used, and a construct with the erythroid cell-specific chicken αD-globin promoter driving CAT gene expression was used as a positive control in HD3 cells and as a negative control in HeLa cells. CAT activity was normalized, considering the efficiency of transfection. Data are the average of three independent experiments, and error bars show the SEM. (C) RT-PCR analysis of ggPRX gene transcription in HD3 cells. (Top) Positions of the regions examined on the map of the upstream part of the chicken α-globin gene domain. (Bottom) Amplification of test regions 1 to 4. Lanes marked “−RT” were loaded with products of direct PCR amplification of RNA (without RT polymerase); lanes marked “DNA” were loaded with products of amplification of 100 ng of chicken genomic DNA.
FIG. 10.
FIG. 10.
Evolutionary conservation of the mutual location of regulatory elements in the upstream regions of α-globin gene domains. (A) Sequence alignment of the putative CTCF-binding site (50 bp) from the CpG island of the upstream region of the chicken α-globin domain, with part of the upstream region of the human α-globin domain (numbers correspond to GenBank sequenceAE006462). The regions of sequence identity are shaded. (B) Upstream regions of the chicken and human α-globin gene domains. Embryonic globin genes are shown by black rectangles, CTCF-binding sites are shown by open ovals, and the non-tissue-specific enhancer from the upstream region of the chicken α-globin gene domain is shown by the filled arrowhead. The promoter region of the human -14 gene and the homologous region from the upstream area of the chicken α-globin gene domain are shown by arrows indicating the direction of -14 gene transcription.

Similar articles

Cited by

References

    1. Anguita, E., C. A. Johnson, W. G. Wood, B. M. Turner, and D. R. Higgs. 2001. Identification of a conserved erythroid specific domain of histone acetylation across the alpha-globin gene cluster. Proc. Natl. Acad. Sci. USA 98:12114-12119. - PMC - PubMed
    1. Bell, A. C., A. G. West, and G. Felsenfeld. 1999. The protein CTCF is required for the enhancer-blocking activity of vertebrate insulators. Cell 98:387-396. - PubMed
    1. Bell, A. C., and G. Felsenfeld. 2000. Methylation of a CTCF-dependent boundary controls imprinted expression of the Igf2 gene. Nature 405:482-485. - PubMed
    1. Beug, H., G. Doederlein, C. Freudenstrein, and T. Graf. 1979. Erythroblast cell lines transformed by a temperature sensitive mutant of avian erythroblastosis virus. A model system to study erythroid differentiation in vitro. J. Cell Physiol. 1:195-207. - PubMed
    1. Beug, H., S. Palmieri, C. Freudenstein, H. Zentgraf, and T. Graf. 1982. Hormone-dependent terminal differentiation in vitro of chicken erythroleukemia cells transformed by ts mutants of avian erythroblastosis virus. Cell 28:907-919. - PubMed

Publication types

MeSH terms

LinkOut - more resources