. 2006 Mar;26(5):1731-42.
doi: 10.1128/MCB.26.5.1731-1742.2006.

Autoregulation of ribosome biosynthesis by a translational response in fission yeast

Affiliations

Autoregulation of ribosome biosynthesis by a translational response in fission yeast

François Bachand et al. Mol Cell Biol. 2006 Mar.

Abstract

Maintaining the appropriate balance between the small and large ribosomal subunits is critical for translation and cell growth. We previously identified the 40S ribosomal protein S2 (rpS2) as a substrate of the protein arginine methyltransferase 3 (RMT3) and reported a misregulation of the 40S/60S ratio in rmt3 deletion mutants of Schizosaccharomyces pombe. For this study, using DNA microarrays, we have investigated the genome-wide biological response of rmt3-null cells to this ribosomal subunit imbalance. Whereas little change was observed at the transcriptional level, a number of genes showed significant alterations in their polysomal-to-monosomal ratios in rmt3Delta mutants. Importantly, nearly all of the 40S ribosomal protein-encoding mRNAs showed increased ribosome density in rmt3 disruptants. Sucrose gradient analysis also revealed that the ribosomal subunit imbalance detected in rmt3-null cells is due to a deficit in small-subunit levels and can be rescued by rpS2 overexpression. Our results indicate that rmt3-null fission yeast compensate for the reduced levels of small ribosomal subunits by increasing the ribosome density, and likely the translation efficiency, of 40S ribosomal protein-encoding mRNAs. Our findings support the existence of autoregulatory mechanisms that control ribosome biosynthesis and translation as an important layer of gene regulation.


Figures
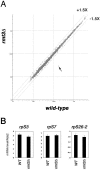
FIG. 1.
FIG. 1.
Genome-wide mRNA profiling of rmt3-null fission yeast cells. (A) Scatter plot of mRNA signals from wild-type (x axis) and rmt3-null (y axis) cells. The scatter plot was generated from averaged data for three independent biological repeats. Dots above the top oblique line represent genes induced >1.5-fold; dots below the bottom oblique line represent genes repressed >1.5-fold. The single gene spot significantly downregulated in rmt3Δ cells corresponds to rmt3 mRNA and is indicated by an arrow. (B) Real-time PCR validation of the genome-wide expression profiling data for three ribosomal protein-encoding genes. mRNA levels for the rpS3, rpS7, and rpS26-2 genes were normalized to that of nda2 mRNA. Error bars were calculated from three independent experiments and represent standard deviations.
FIG.2.
FIG.2.
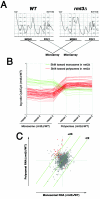
Analysis of translational state of rmt3-null cells at the genome-wide level. (A) Fractionated polysome profiles of wild-type (WT) and rmt3-null (rmt3Δ) extracts were subsequently pooled into monosomal (mono) and polysomal (poly) fractions. Monosomal RNAs isolated from wild-type and rmt3Δ cells were converted to labeled cDNAs and competitively hybridized to DNA microarrays; polysomal RNAs isolated from wild-type and rmt3Δ cells were processed in the same way. (B) Translational changes in rmt3Δ mutant cells. RNAs from monosomal and polysomal fractions from rmt3Δ cell extracts were reverse transcribed with Cy5 and directly compared to Cy3-labeled cDNAs from wild-type (WT) monosomal and polysomal fractions, respectively. The results displayed are for three biological repeats (x axis). Intensity ratios (rmt3Δ/WT) for the mRNAs are plotted on the y axis on a log scale. Genes displayed in red (n = 59) showed a shift towards polysomal fractions in rmt3Δ cells compared to wild-type cells, whereas genes displayed in green (n = 12) showed a shift towards monosomal fractions in rmt3Δ cells compared to wild-type cells. (C) Genome-wide changes in the polysomal-to-monosomal RNA ratio in rmt3Δ cells. Using mean data for the three biological repeats, an rmt3Δ mutant/wild-type signal ratio was calculated for each monosomal and polysomal mRNA detected in two of three biological repeats. A scatter plot of the normalized monosomal (x axis) and polysomal (y axis) RNA signals is shown. Red spots represent genes coding for 40S ribosomal proteins.
FIG. 3.
FIG. 3.
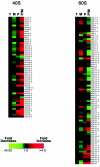
Gene expression changes of ribosomal protein-encoding mRNAs in rmt3-null cells. Each colored square represents the average ratio of total (T), monosomal (M), or polysomal (P) mRNAs isolated from rmt3-null cells relative to wild-type cells from three biological repeats. Polysomal-to-monosomal (P/M) RNA ratios are also represented and were calculated based on the average and normalized monosomal and polysomal ratios. Black squares denote no significant alteration in the amount of RNA isolated from rmt3Δ or wild-type cells; red and green squares denote ribosomal protein mRNAs that were more or less abundant, respectively. The intensity of the color is proportional to the log2 increase or decrease, as indicated on the intensity scale.
FIG.4.
FIG.4.
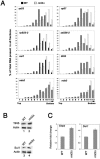
High-resolution analysis of mRNA distributions across polysome profiles for selected genes and effects on the synthesis of TIF45 and SUI1 proteins. (A) Specific mRNAs selected from Table 1 were quantitatively analyzed over the entire polysomal profile by real-time PCR. The nda2 and nda3 genes were selected as control mRNAs whose distribution did not change based on the microarray analysis. Black and white bars represent the percentage of total RNA present in each fraction for wild-type (WT) and rmt3-null (rmt3Δ) cells, respectively. The data are the averages of two independent biological replicates. (B) Total cell lysates prepared from wild-type (WT; lanes 1 and 3) and rmt3-null (rmt3Δ; lanes 2 and 4) cells were resolved by SDS-PAGE on 13% gels, transferred to nitrocellulose membranes, and immunoblotted simultaneously with both mouse antiactin and rabbit anti-Tif45 (top panel) or mouse antiactin and rabbit anti-Sui1 (bottom panel). Membranes were then probed with different fluorescently coupled secondary antibodies (see Materials and Methods) and detected using the Odyssey infrared imaging system (LI-COR). (C) Tif45 and Sui1 protein levels were normalized to the actin signal, using Odyssey quantification software. The obtained protein ratios were then normalized to wild-type (WT) levels. The results represent the averages of three independent biological repeats.
FIG. 5.
FIG. 5.
The ribosomal subunit imbalance of rmt3-null cells is caused by a small-subunit deficit and can be rescued by rpS2 overexpression. (A) Sucrose gradient analysis of 25 A254 units from extracts prepared from wild-type (gray line) and rmt3-null (black line) fission yeast. Small (40S) and large (60S) ribosomal subunits as well as 80S monosomes are indicated. (B) Sucrose gradient analysis of 25 A254 units from extracts prepared from wild-type (WT; top panel) and rmt3-null (rmt3Δ; bottom panel) fission yeast previously transformed with an empty vector control (gray line) or a vector expressing a C-terminal FLAG-tagged rpS2 protein (black line). (C) Sucrose gradient analysis of 25 A254 units from extracts prepared from rmt3-null fission yeast previously transformed with an empty vector control (gray lines; top and bottom panels) or a vector expressing a C-terminal FLAG-tagged rpS3 (black line; top panel) or FLAG-tagged rpS7 (black line; bottom panel) protein. (D) Total cell lysates prepared from rmt3-null cells previously transformed with an empty vector control (lane 1) or vectors expressing C-terminal FLAG-tagged versions of rpS2 (lane 2), rpS3 (lane 3), and rpS7 (lane 4) were resolved by SDS-PAGE on 12% gels, transferred to nitrocellulose membranes, and immunoblotted with an affinity-purified FLAG antibody. Molecular size standards are indicated on the right, in kilodaltons.
FIG. 6.
FIG. 6.
Expression of rpS2 restores ribosome densities of rpS23-2 and rpS26-2 mRNAs to wild-type levels. rpS23-2 and rpS26-2 mRNAs were quantitatively analyzed over the entire polysomal profile by real-time PCR. (A) Bar graphs representing the percentage of total RNA present in each fraction for rmt3-null cells previously transformed with a vector control (black bars) or a vector expressing rpS2-Flag (white bars). (B) Bar graphs representing the percentage of total RNA present in each fraction for rmt3-null cells previously transformed with a vector control (black bars) or a vector expressing rpS3-Flag (white bars). The data are the averages of two independent biological replicates.

References

    1. Abovich, N., L. Gritz, L. Tung, and M. Rosbash. 1985. Effect of RP51 gene dosage alterations on ribosome synthesis in Saccharomyces cerevisiae. Mol. Cell. Biol. 5:3429-3435. - PMC - PubMed
    1. Amsterdam, A., K. C. Sadler, K. Lai, S. Farrington, R. T. Bronson, J. A. Lees, and N. Hopkins. 2004. Many ribosomal protein genes are cancer genes in zebrafish. PLoS Biol. 2:E139. - PMC - PubMed
    1. Ashburner, M., C. A. Ball, J. A. Blake, D. Botstein, H. Butler, J. M. Cherry, A. P. Davis, K. Dolinski, S. S. Dwight, J. T. Eppig, M. A. Harris, D. P. Hill, L. Issel-Tarver, A. Kasarskis, S. Lewis, J. C. Matese, J. E. Richardson, M. Ringwald, G. M. Rubin, and G. Sherlock. 2000. Gene ontology: tool for the unification of biology. The Gene Ontology Consortium. Nat. Genet. 25:25-29. - PMC - PubMed
    1. Bachand, F., and P. A. Silver. 2004. PRMT3 is a ribosomal protein methyltransferase that affects the cellular levels of ribosomal subunits. EMBO J. 23:2641-2650. - PMC - PubMed
    1. Bedford, M. T., and S. Richard. 2005. Arginine methylation, an emerging regulator of protein function. Mol. Cell 18:263-272. - PubMed

Publication types

MeSH terms

LinkOut - more resources