. 2006 Mar;36(3):671-80.
doi: 10.1002/eji.200535353.

Pertussis toxin as an adjuvant suppresses the number and function of CD4+CD25+ T regulatory cells

Affiliations

Pertussis toxin as an adjuvant suppresses the number and function of CD4+CD25+ T regulatory cells

Xin Chen et al. Eur J Immunol. 2006 Mar.

Abstract

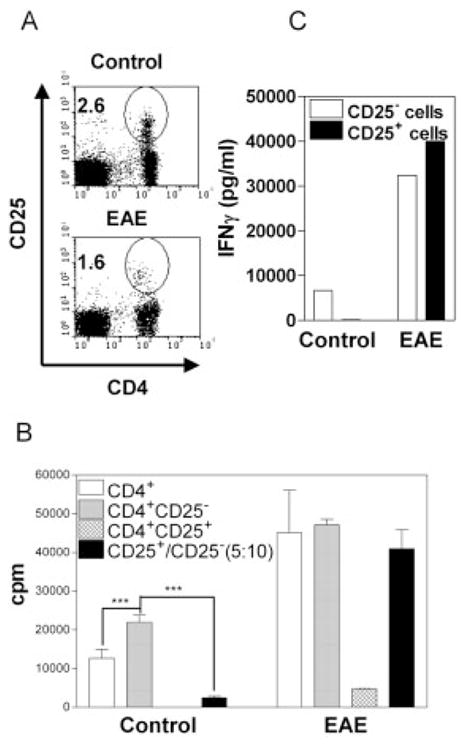
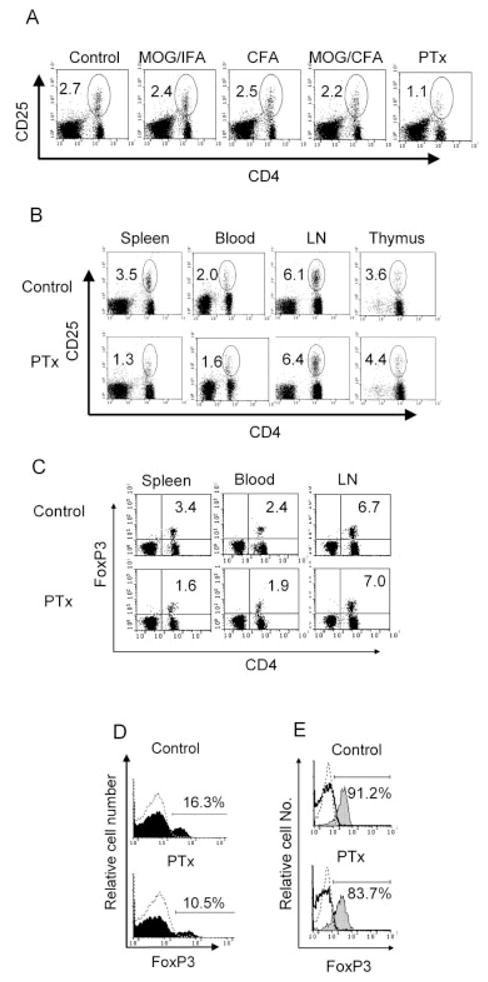
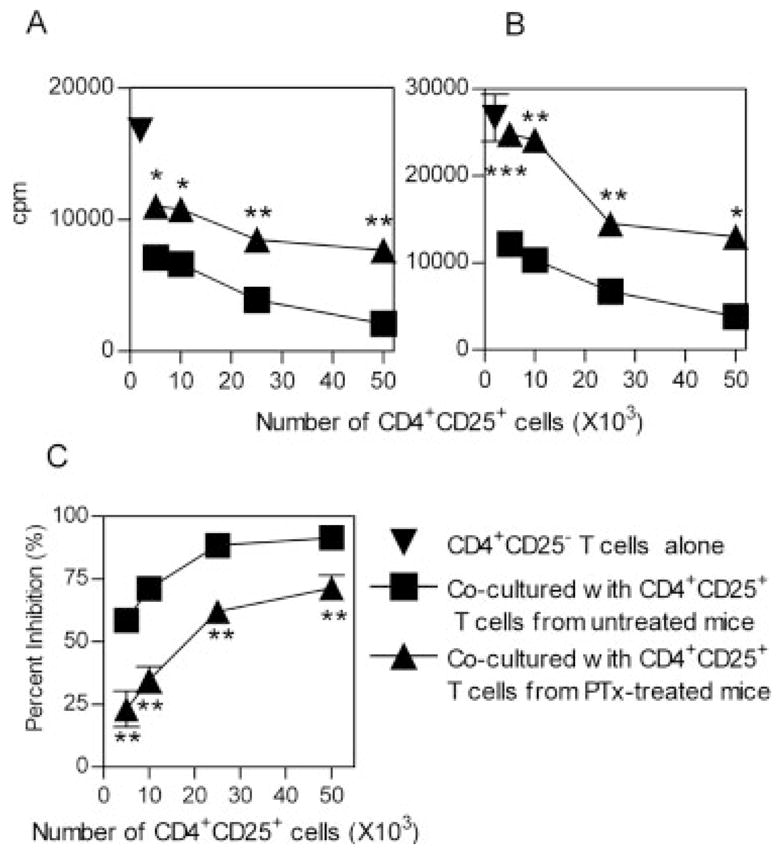
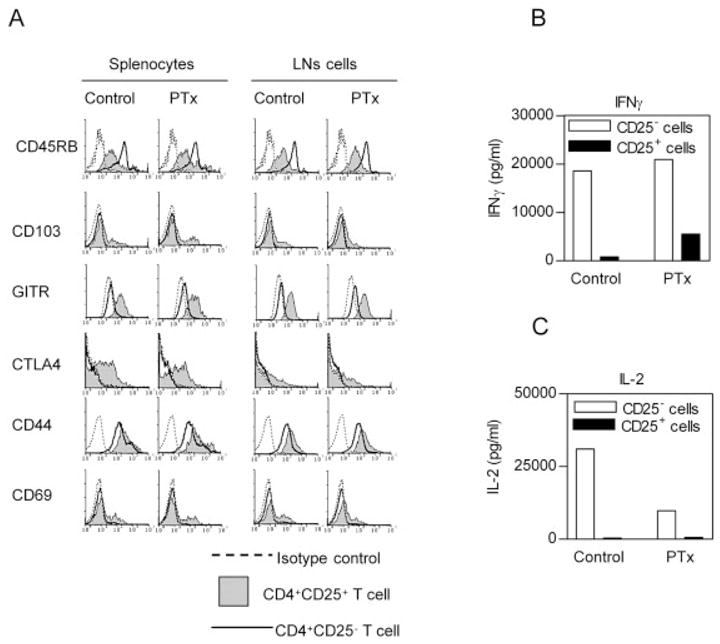
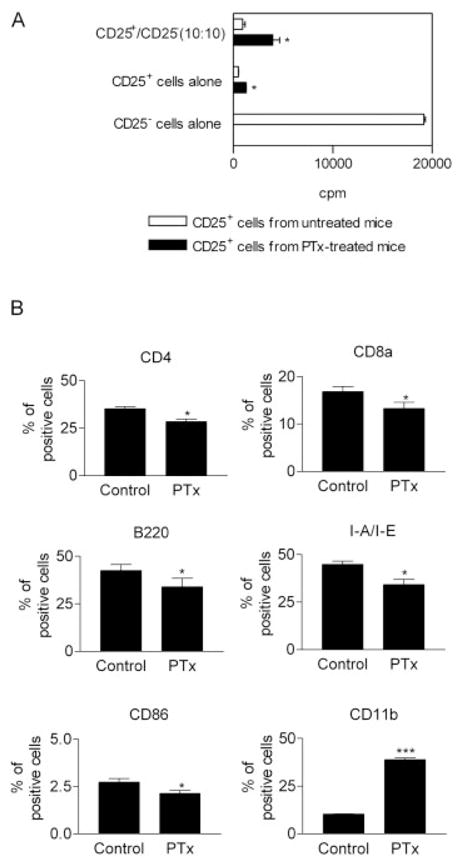
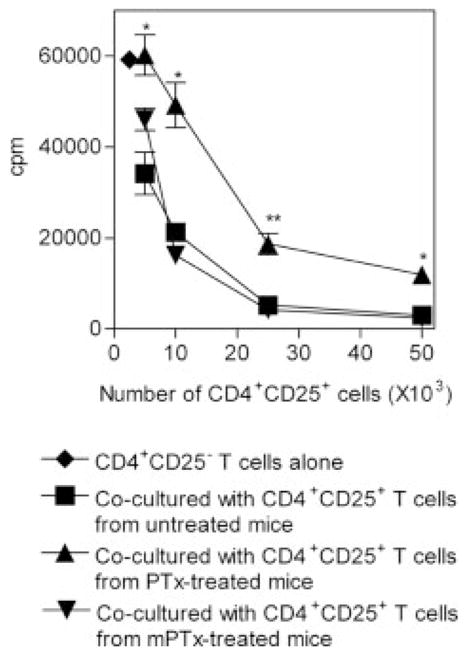
We observed a remarkable reduction in the frequency and immunosuppressive activity of splenic CD4+CD25+ T cells in C57BL/6 mice with MOG33-55-induced experimental autoimmune encephalomyelitis (EAE). Our study revealed that pertussis toxin (PTx), one component of the immunogen used to induce murine EAE, was responsible for down-regulating splenic CD4+CD25+ cells. Treatment of normal BALB/c mice with PTx in vivo reduced the frequency, suppressive activity and FoxP3 expression by splenic CD4+CD25+ T cells. However, PTx treatment did not alter the expression of characteristic phenotypic markers (CD45RB, CD103, GITR and CTLA-4) and did not increase the expression of CD44 and CD69 by the residual splenic and lymph node CD4+CD25+ T cells. This property of PTx was attributable to its ADP-ribosyltransferase activity. PTx did not inhibit suppressive activity of purified CD4+CD25+ T regulatory (Treg) cells in vitro, but did so in vivo, presumably due to an indirect effect. Although the exact molecular target of PTx that reduces Treg activity remains to be defined, our data suggests that alteration of both distribution and function of splenic immunocytes should play a role. This study concludes that an underlying cause for the immunological adjuvanticity of PTx is down-regulation of Treg cell number and function.


Figures

Figure 1
Figure 1
EAE induction reduces frequency and immunosuppressive function of CD4+CD25+ splenocytes. Splenocytes were isolated from B6 mice on day 10 post immunization with EAE immunogen. (A) The cells were analyzed for expression of CD4 and CD25 by FACS. Numbers in the dot plot indicate the percentage of CD4+CD25+ cells. The data are representative of five separate experiments. (B) MACS-purified CD4 (5 × 10⁴ cells/well, open bar) cells and FACS-purified CD4+CD25 (5 × 10⁴ cells/well, gray bar) and CD4+CD25+ (2.5 × 10⁴ cells/ well, hatched bar) splenocytes were cultured separately or co-cultured (black bar, ratio of CD25 versus CD25+ cells was 10:5, from the same group). The cells were stimulated with normal B6 APC (2 × 10⁵ cells/well) and an anti-CD3 antibody (0.5 μg/ mL) for 72 h. Proliferation was measured by [3H]thymidine incorporation. ***p<0.001 compared with proliferation of CD4+CD25 T cells. (C) FACS-purified CD4+CD25+ or CD4+CD25T cells were stimulated with 10 μg/mL of a plate-bound anti-CD3 antibody and 2 μg/mL of a soluble anti-CD28 antibody. After 72 h, the supernatants were collected and IFN-γ levels were determine. Data (B, C) are representative of three separate experiments with the similar results.
Figure 2
Figure 2
In vivo PTx treatment reduces the proportion of CD4+CD25+ T cells and CD4+FoxP3+ T cells. (A) Female B6 mice were treated with MOG peptide in IFA, or CFA, or MOG peptide in CFA or PTx for 2 days (once a day) as described in the Materials and methods. One week after the last treatment, spleens were harvested and the proportion of CD4+CD25+ T cells was analyzed by FACS. The data are representative of two separate experiments with similar results. (B–E) BALB/c mice were treated with PTx (400 ng/mouse/day, i.p.) for 2 days. One week after the last injection, the mice were killed and the percentage of CD4+CD25+ T cells (B) and CD4+FoxP3+ T cells (C) in the lymphoid tissues and peripheral blood was analyzed by FACS. (D) FoxP3 expression was analyzed by gating on CD3+CD4+ splenic cells. Dashed histogram indicates isotype control; black histogram indicates FoxP3 staining. (E) FoxP3 expression was analyzed by gating on CD4+CD25+ (gray histogram) and CD4+CD25 (solid line histogram) splenic cells. Dashed histogram indicates isotype control. The data are representative of at least three separate experiments with similar results. The number in the dot plot indicates the percentage of CD4+CD25+ T cells or CD4+FoxP3+ T cells.
Figure 3
Figure 3
In vivo PTx treatment reduces the suppressor effect of splenic CD4+CD25+ T cells. CD4+CD25+ and CD4+CD25 T cells were purified by flow cytometry, from MACS-purified CD4 cells derived from spleen. CD4+CD25 T cells (5 × 10⁴ cells/well) were mixed with increasing numbers of CD4+CD25+ T cells (5 × 10³–5 × 10⁴ cells/well). The cells were stimulated with APC (from normal control mice, 2 × 10⁵ cells/well) plus a soluble anti-CD3 antibody (0.5 μg/mL) and cultured for 72 h. Proliferation was measured by [3H]thymidine incorporation. The responder CD4+CD25 T cells were either from normal control mice (A) or from PTx-treated mice (B). The inverted triangle indicates CD4+CD25 T cells alone; the square indicates untreated mice derived-CD4+CD25+ T cells mixed with CD4+CD25 T cells; the triangle indicates CD4+CD25 T cells mixed with CD4+CD25+ T cells derived from PTx-treated mice. The data shown are representative of at least five separate experiments with similar results. (C) Percent inhibition of CD4+CD25+ T cells from normal control (squares) or PTx-treated (triangles) mouse spleen to the proliferation of normal control mouse CD4+CD25 T cells. The data shown are summarized from five separate experiments (with three to five mice per group). *p<0.05, **p<0.01, and ***p<0.001, compared with inhibition elicited by normal mouse CD4+CD25+ T cells.
Figure 4
Figure 4
In vivo PTx treatment does not change phenotypic characteristics of CD4+CD25+ T cells (A) Female BALB/c mice were treated with PTx (400 ng/mouse) for 2 days. At 1 week after the last injection, the spleen and LN were harvested. After lysing erythrocytes, the splenic cell or LN cells were stained with Cy-chrome-CD4, PE- or FITC-conjugated CD25, FITC- or PE-conjugated third antibodies. Analyses were gated on CD4+CD25+ or CD4+CD25 T cells. Dashed line indicates isotype control, gray histogram indicates CD4+CD25+ T cells and solid line indicates CD4+CD25 T cells. Y-axis shows relative cell number. X-axis shows fluorescence intensity. The data are representative of three separate experiments with similar results. (B, C) Purified splenic CD4+CD25+ or CD4+CD25 cells (5 × 10⁴ cells) were seeded in round-bottom 96-well plates. The cells were stimulated using plate-bound anti-CD3 (10 μg/mL) and soluble anti-CD28 (2 μg/mL) for 72 h. The production of IFN-γ (B) and IL-2 (C) in the supernatants was determined. Data shown are representatives of three separate experiments with similar results.
Figure 5
Figure 5
APC from PTx-treated mice support suppression by Treg cells. (A) The suppression by CD4+CD25+ splenocytes (5 × 10⁴ cells/well) from normal control mice or PTx-treated mice (400 ng/mouse/day, 2 days) were assessed by culture with the same number of normal BALB/c CD4+CD25 splenocytes. The cells were stimulated with APC from PTx-treated mice (2 × 10⁵ cells/well) and 0.5 μg/mL anti-CD3. The proliferation was measured by [3H]thymidine incorporation. Data shown are representative of three separate experiments with similar results. *p<0.05, compared with cells from control mice. (B) BALB/c mice were treated with PTx (400 ng/mouse/day, 2 days) and splenocytes were isolated and analyzed for expression of surface markers by FACS. The data shown are percent of positive cells (means ± SD), which is summarized from seven separate experiments (n=35). *p<0.05, ***p<0.001, compared with normal control mice.
Figure 6
Figure 6
S1 mutant PTx fails to reduce the activity of CD4+CD25+ Treg cells. BALB/c mice were injected (i.p.) with 400 ng/mL of wild-type PTx or S1 mutant PTx (mPTx) for 2 days. Spleens were harvested 1 week after the last injection. The indicated number of FACS-sorted CD4+CD25+ splenocytes from either untreated mice (square), wild-type PTx-treated mice (triangle) or S1 mutant PTx (inverted triangle) were mixed with normal mouse CD4+CD25 splenocytes (5 × 10⁴ cells/ well). The cells were stimulated with APC (from untreated mice) and 0.5 μg/mL soluble anti-CD3 and cultured for 72 h. Proliferation was measured by [3H]thymidine incorporation. *p<0.05, **p<0.01, compared with the inhibition elicited by normal BALB/c CD4+CD25+ splenocytes. The data shown are representative of three separate experiments with similar results.

References

    1. Sakaguchi S. Regulatory T cells: key controllers of immunologic self-tolerance. Cell. 2000;101:455–458. - PubMed
    1. Sugiyama H, Gyulai R, Toichi E, Garaczi E, Shimada S, Stevens SR, McCormick TS, Cooper KD. Dysfunctional blood and target tissue CD4+CD25high regulatory T cells in psoriasis: mechanism underlying unrestrained pathogenic effector T cell proliferation. J Immunol. 2005;174:164–173. - PMC - PubMed
    1. Balandina A, Lecart S, Dartevelle P, Saoudi A, Berrih-Aknin S. Functional defect of regulatory CD4+CD25+ Tcells in the thymus of patients with autoimmune myasthenia gravis. Blood. 2005;105:735–741. - PMC - PubMed
    1. Ehrenstein MR, Evans JG, Singh A, Moore S, Warnes G, Isenberg DA, Mauri C. Compromised function of regulatory T cells in rheumatoid arthritis and reversal by anti-TNFalpha therapy. J Exp Med. 2004;200:277–285. - PMC - PubMed
    1. Longhi MS, Ma Y, Bogdanos DP, Cheeseman P, Mieli-Vergani G, Vergani D. Impairment of CD4(+)CD25(+) regulatory T-cells in autoimmune liver disease. J Hepatol. 2004;41:31–37. - PubMed

Publication types

MeSH terms