. 2006 Feb 15:7:70.
doi: 10.1186/1471-2105-7-70.

BIOZON: a system for unification, management and analysis of heterogeneous biological data

Affiliations

BIOZON: a system for unification, management and analysis of heterogeneous biological data

Aaron Birkland et al. BMC Bioinformatics. .

Abstract

Background: Integration of heterogeneous data types is a challenging problem, especially in biology, where the number of databases and data types increase rapidly. Amongst the problems that one has to face are integrity, consistency, redundancy, connectivity, expressiveness and updatability.

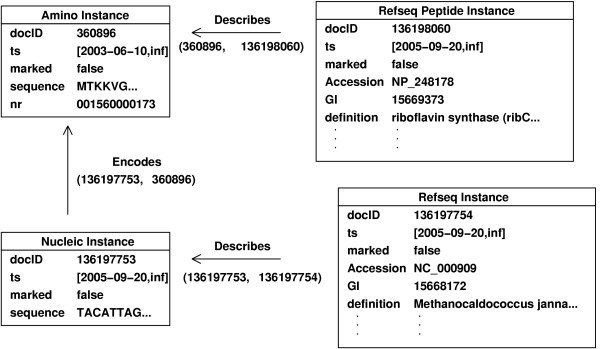
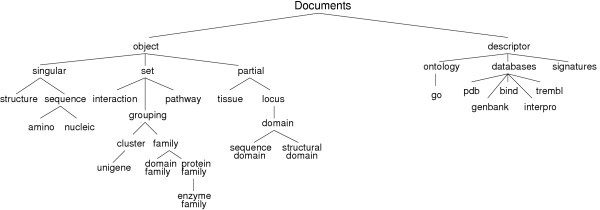
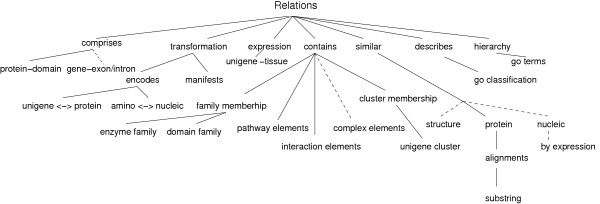
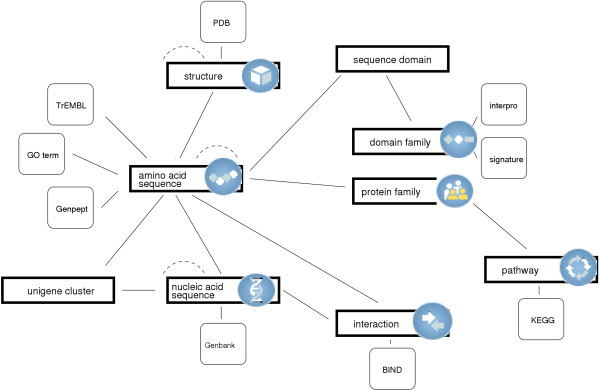
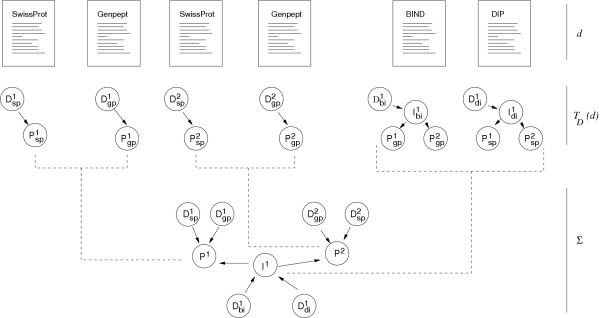
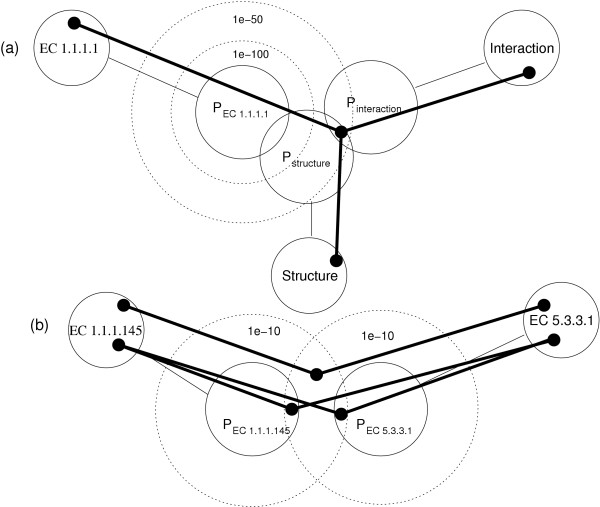
Description: Here we present a system (Biozon) that addresses these problems, and offers biologists a new knowledge resource to navigate through and explore. Biozon unifies multiple biological databases consisting of a variety of data types (such as DNA sequences, proteins, interactions and cellular pathways). It is fundamentally different from previous efforts as it uses a single extensive and tightly connected graph schema wrapped with hierarchical ontology of documents and relations. Beyond warehousing existing data, Biozon computes and stores novel derived data, such as similarity relationships and functional predictions. The integration of similarity data allows propagation of knowledge through inference and fuzzy searches. Sophisticated methods of query that span multiple data types were implemented and first-of-a-kind biological ranking systems were explored and integrated.

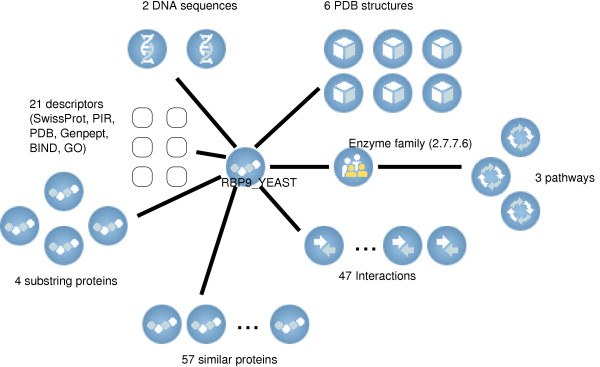
Conclusion: The Biozon system is an extensive knowledge resource of heterogeneous biological data. Currently, it holds more than 100 million biological documents and 6.5 billion relations between them. The database is accessible through an advanced web interface that supports complex queries, "fuzzy" searches, data materialization and more, online at http://biozon.org.


Figures

Figure 1
Figure 1
Document Instances. Abbreviated instances of an amino acid and nucleic acid sequence objects with their respective descriptors, as mapped to the Biozon data graph from a single RefSeq document. The two objects are related by an 'encodes' relation e = (136197753, 360896), and are each related to descriptor annotation separately through 'describes' relations.
Figure 2
Figure 2
A partial snapshot of the Biozon hierarchical document classification model. A major distinction is made between descriptors and objects (see text for details). The presence of a particular class in the hierarchy can arise due to physical or semantic differences in the nature of the documents therein. For example, amino acids and nucleic acids are both stored as text strings in the database and their internal representations are identical (although over different alphabets). However, they represent fundamentally different real-world objects and should be classified as such. A special subclass of objects is locus. This type serves to localize information with respect to larger objects or to represent efficiently objects that are essentially sub-entities of other existing objects (for example, a protein domain is a locus with respect to a protein sequence, with specific start and end positions).
Figure 3
Figure 3
A partial snapshot of the Biozon hierarchical relation classification model. The primary motivation for the partitioning of the hierarchy is a difference in the semantic meaning of relationships between documents. Expansion of this hierarchy is expected as new relationships are added. Planned additions in the near future are shown as dashed lines.
Figure 4
Figure 4
Partial overview of the Biozon schema. Similarity relations are depicted with dashed lines. The database will be gradually extended to span both new source data types as well as new derived data.
Figure 5
Figure 5
Data integration. Individual elements d from source databases are translated to their representation in Biozon as per the transformation function TD. The graph ∑ resulting from integration of these elements has non-redundant objects, serving to merge the data from disparate sources into a cohesive whole. As shown, six records from GenPept, SwissProt BIND and DIP are translated into Biozon graph form. Each record is transformed into a set of objects (e.g. Pgp1 MathType@MTEF@5@5@+=feaafiart1ev1aaatCvAUfKttLearuWrP9MDH5MBPbIqV92AaeXatLxBI9gBaebbnrfifHhDYfgasaacH8akY=wiFfYdH8Gipec8Eeeu0xXdbba9frFj0=OqFfea0dXdd9vqai=hGuQ8kuc9pgc9s8qqaq=dirpe0xb9q8qiLsFr0=vr0=vr0dc8meaabaqaciaacaGaaeqabaqabeGadaaakeaacqWGqbaudaqhaaWcbaGaem4zaCMaemiCaahabaGaeGymaedaaaaa@31B2@) and descriptors (e.g. Dgp1 MathType@MTEF@5@5@+=feaafiart1ev1aaatCvAUfKttLearuWrP9MDH5MBPbIqV92AaeXatLxBI9gBaebbnrfifHhDYfgasaacH8akY=wiFfYdH8Gipec8Eeeu0xXdbba9frFj0=OqFfea0dXdd9vqai=hGuQ8kuc9pgc9s8qqaq=dirpe0xb9q8qiLsFr0=vr0=vr0dc8meaabaqaciaacaGaaeqabaqabeGadaaakeaacqWGebardaqhaaWcbaGaem4zaCMaemiCaahabaGaeGymaedaaaaa@319A@). Identical proteins from SwissProt and GenPept records, Psp1 MathType@MTEF@5@5@+=feaafiart1ev1aaatCvAUfKttLearuWrP9MDH5MBPbIqV92AaeXatLxBI9gBaebbnrfifHhDYfgasaacH8akY=wiFfYdH8Gipec8Eeeu0xXdbba9frFj0=OqFfea0dXdd9vqai=hGuQ8kuc9pgc9s8qqaq=dirpe0xb9q8qiLsFr0=vr0=vr0dc8meaabaqaciaacaGaaeqabaqabeGadaaakeaacqWGqbaudaqhaaWcbaGaem4CamNaemiCaahabaGaeGymaedaaaaa@31CA@ and Pgp1 MathType@MTEF@5@5@+=feaafiart1ev1aaatCvAUfKttLearuWrP9MDH5MBPbIqV92AaeXatLxBI9gBaebbnrfifHhDYfgasaacH8akY=wiFfYdH8Gipec8Eeeu0xXdbba9frFj0=OqFfea0dXdd9vqai=hGuQ8kuc9pgc9s8qqaq=dirpe0xb9q8qiLsFr0=vr0=vr0dc8meaabaqaciaacaGaaeqabaqabeGadaaakeaacqWGqbaudaqhaaWcbaGaem4zaCMaemiCaahabaGaeGymaedaaaaa@31B2@ respectively, are instantiated as a single non-redundant protein object P1 on the graph. Similarly, Psp2 MathType@MTEF@5@5@+=feaafiart1ev1aaatCvAUfKttLearuWrP9MDH5MBPbIqV92AaeXatLxBI9gBaebbnrfifHhDYfgasaacH8akY=wiFfYdH8Gipec8Eeeu0xXdbba9frFj0=OqFfea0dXdd9vqai=hGuQ8kuc9pgc9s8qqaq=dirpe0xb9q8qiLsFr0=vr0=vr0dc8meaabaqaciaacaGaaeqabaqabeGadaaakeaacqWGqbaudaqhaaWcbaGaem4CamNaemiCaahabaGaeGOmaidaaaaa@31CC@ and Pgp2 MathType@MTEF@5@5@+=feaafiart1ev1aaatCvAUfKttLearuWrP9MDH5MBPbIqV92AaeXatLxBI9gBaebbnrfifHhDYfgasaacH8akY=wiFfYdH8Gipec8Eeeu0xXdbba9frFj0=OqFfea0dXdd9vqai=hGuQ8kuc9pgc9s8qqaq=dirpe0xb9q8qiLsFr0=vr0=vr0dc8meaabaqaciaacaGaaeqabaqabeGadaaakeaacqWGqbaudaqhaaWcbaGaem4zaCMaemiCaahabaGaeGOmaidaaaaa@31B4@ are mapped to a single P2. As a result, the two interaction objects Ibi1 MathType@MTEF@5@5@+=feaafiart1ev1aaatCvAUfKttLearuWrP9MDH5MBPbIqV92AaeXatLxBI9gBaebbnrfifHhDYfgasaacH8akY=wiFfYdH8Gipec8Eeeu0xXdbba9frFj0=OqFfea0dXdd9vqai=hGuQ8kuc9pgc9s8qqaq=dirpe0xb9q8qiLsFr0=vr0=vr0dc8meaabaqaciaacaGaaeqabaqabeGadaaakeaacqWGjbqsdaqhaaWcbaGaemOyaiMaemyAaKgabaGaeGymaedaaaaa@318C@ (BIND) and Idi1 MathType@MTEF@5@5@+=feaafiart1ev1aaatCvAUfKttLearuWrP9MDH5MBPbIqV92AaeXatLxBI9gBaebbnrfifHhDYfgasaacH8akY=wiFfYdH8Gipec8Eeeu0xXdbba9frFj0=OqFfea0dXdd9vqai=hGuQ8kuc9pgc9s8qqaq=dirpe0xb9q8qiLsFr0=vr0=vr0dc8meaabaqaciaacaGaaeqabaqabeGadaaakeaacqWGjbqsdaqhaaWcbaGaemizaqMaemyAaKgabaGaeGymaedaaaaa@3190@ (DIP) are mapped to the same object I1.
Figure 6
Figure 6
A subset of the Biozon data graph. Objects (rectangular shapes), descriptors (rounded boxes), and the relations between them form a typical subset of the Biozon data graph. The subgraph consists of two protein sequences that are described by a number of different descriptors and are related to a common Family object. Creating this graph requires data from a number of different databases or computations. Gathering data is a matter of traversing a portion of the graph and examining the nodes. For each node, it is possible to obtain a set of all relations connecting that document to another. Searches serve as an entry point to the data graph, from which the graph may be navigated to see the object's context.
Figure 7
Figure 7
The broader context of RPB9_YEAST as appears in Biozon. DocID is 262161
Figure 8
Figure 8
An interaction map of Vaccinia virus proteins. The protein-protein interaction data in Biozon can be viewed as a subgraph, with many interconnected elements. From this graph we compiled the set of all connected components, and each component was embedded in a two-dimensional Euclidean space, using the algorithm of 48 with the graph distances as input. The map shown is a subnetwork of Vaccinia virus proteins that seem to control its activity through a series of mediated interactions or by forming a complex. For example, the inactivation of protein G2 (docID 507266) renders the virus dependent upon isatin-beta-thiosemicarbazone for growth. This protein interacts with Envelope protein H5 (docID 465934) that interacts with protein A49 (840436) whose function is unknown, as well with Viral DNA polymerase processivity factor. The latter interacts with UDG (Uracil-DNA glycosylase docID 502617), as well as with protein D5 (Putative DNA replication factor). Proteins that directly interact are positioned closely in this map, while proteins that are connected through mediated interactions are positioned farther apart. The set of 7 proteins in this connected component form an interesting subgraph that was exposed with the embedding algorithm.
Figure 9
Figure 9
Graphical representation of a fuzzy search. (a) Complex searches find paths in the data graph. In this pictorial representation, nodes in result paths must occur where sets of objects satisfying different search constraints intersect. Introducing similarity extends some query steps to include similar results, thus enabling the discovery of paths in the graph where none existed before. This graph illustrates a complex fuzzy search for structures of proteins that belong to enzyme family 1.1.1.1 and are involved in known interactions. Circles on the graph represent sets of matching documents, and where they intersect, there are matches. The dotted lines represent extensions to the sets based on similarity. Without similarity, the set of proteins with structures (Pstructures) intersects with the set of proteins in enzyme family 1.1.1.1 (P1.1.1.1), meaning that there exists a protein with a structure that is a 1.1.1.1 enzyme. Likewise, Pstructure intersects with Pinteraction. However, there is no intersection between the three sets, and therefore no proteins that are in family 1.1.1.1 and involved in an interaction. Creating a fuzzy search with threshold of 1e-100 extends the set of 1.1.1.1 proteins but there are still no matching results. Increasing the threshold to 1e-50 produces the desired intersection, thus allowing connected paths spanning the entire query space. (b) Similarity may be introduced at multiple graph steps, further increasing the solution space to a complex query. For example, a search for E. Coli proteins that are members of enzyme families 1.1.1.145 and 5.3.3.1 returns no results. There are two possible areas in the query graph where similarity relations may be used to extend the query to fuzzy results: on proteins that are classified as 1.1.1.145, and on proteins that are classified as 5.3.3.1. When the evalue threshold is reduced to 1e-10 one protein (docID 737980) is returned with intriguing similarity to proteins that contain both domains. These proteins are observed in higher organisms as part of the estrogen, androgen and C21-Steroid hormone metabolism pathways.
Figure 10
Figure 10
Different topology graphs over the same data types. These topologies involve the same three data types, but have completely different biological meanings. The first corresponds to a protein that is encoded by a DNA sequence and interact with it as well. The second indicates that the protein and the DNA sequence are interacting. The third indicates that the DNA encodes for the protein and the protein is involved in an interaction with a third partner, and the fourth indicates that the DNA sequence both encodes a protein and is involved in an interaction.
Figure 11
Figure 11
Observed graph topologies between proteins and nucleic acids with a maximum path length of 4. The number of occurrences of each topology instance is visible below each topology, using data current as of September 2005.
Figure 12
Figure 12
Ranking of results. These are the top 5 ranked results of a search for proteins with 'cancer' in their definition. Results of high rank tend to be linked to many other entities.

References

    1. Bairoch A, Apweiler R. The SWISS-PROT protein sequence database and its supplement TrEMBL in 2000. Nucleic Acids Res. 2000;28:45–48. - PMC - PubMed
    1. George DG, Barker WC, Mewes HW, Pfeiffer F, Tsugita A. The PIR-International Protein Sequence Database. Nucleic Acids Research. 1996;24:17–20. - PMC - PubMed
    1. Benson DA, Boguski MS, Lipman DJ, Ostell J, Ouellette BFF, Rapp BA, Wheeler DL. GenBank. Nucleic Acids Research. 1999;27:12–17. - PMC - PubMed
    1. Bader GD, Donaldson I, Wolting C, Ouellette BFF, Pawson T, Hogue CWV. BIND – The Biomolecular Interaction Network Database. Nucleic Acids Research. 2001;29:242–245. - PMC - PubMed
    1. Xenarios I, Fernandez E, Salwinski L, Duan XJ, Thompson MJ, Marcotte EM, Eisenberg D. DIP: The Database of Interacting Proteins: 2001 update. Nucleic Acids Research. 2001;29:239–241. - PMC - PubMed

Publication types

LinkOut - more resources