. 2006 Feb 16:4:9.
doi: 10.1186/1479-5876-4-9.

The thrombopoietin receptor, c-Mpl, is a selective surface marker for human hematopoietic stem cells

Affiliations

The thrombopoietin receptor, c-Mpl, is a selective surface marker for human hematopoietic stem cells

John M Ninos et al. J Transl Med. .

Abstract

Background: Thrombopoietin (TPO), the primary cytokine regulating megakaryocyte proliferation and differentiation, exerts significant influence on other hematopoietic lineages as well, including erythroid, granulocytic and lymphoid lineages. We previously demonstrated that the receptor for TPO, c-mpl, is expressed by a subset of human adult bone marrow hematopoietic stem/progenitor cells (HSC/PC) that are enriched for long-term multilineage repopulating ability in the SCID-hu Bone in vivo model of human hematopoiesis.

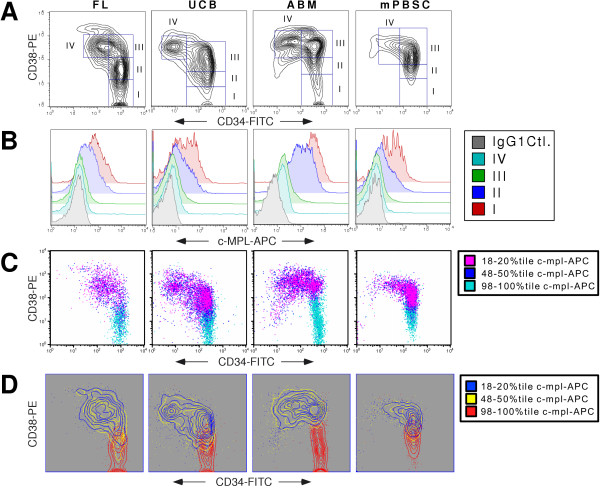
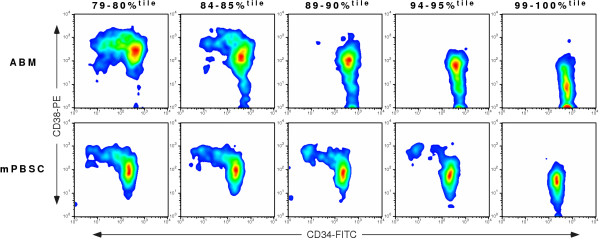
Methods: Here, we employ flow cytometry and an anti-c-mpl monoclonal antibody to comprehensively define the surface expression pattern of c-mpl in four differentiation stages of human CD34+ HSC/PC (I: CD34+38--, II: CD34+38dim, III: CD34+38+, IV: CD34dim38+) for the major sources of human HSC: fetal liver (FL), umbilical cord blood (UCB), adult bone marrow (ABM), and cytokine-mobilized peripheral blood stem cells (mPBSC). We use a surrogate in vivo model of human thymopoiesis, SCID-hu Thy/Liv, to compare the capacity of c-mpl+ vs. c-mpl-- CD34+38--/dim HSC/PC for thymocyte reconstitution.

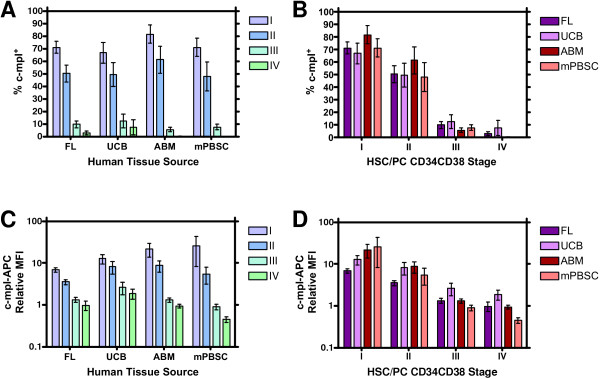
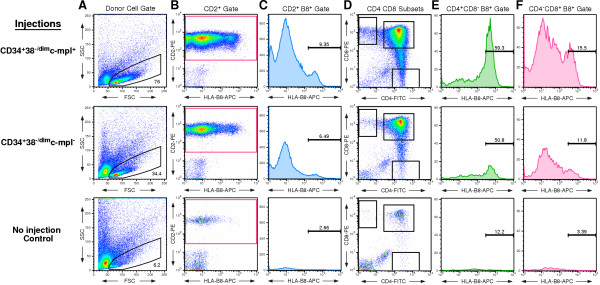
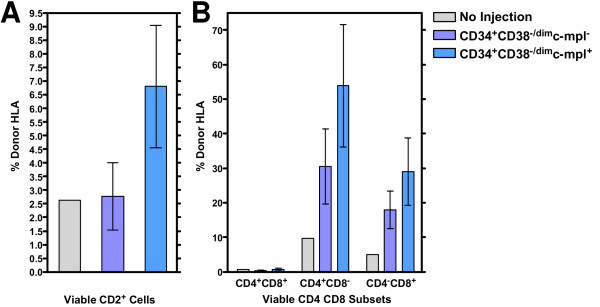
Results: For all tissue sources, the percentage of c-mpl+ cells was significantly highest in stage I HSC/PC (FL 72 +/- 10%, UCB 67 +/- 19%, ABM 82 +/- 16%, mPBSC 71 +/- 15%), and decreased significantly through stages II, III, and IV ((FL 3 +/- 3%, UCB 8 +/- 13%, ABM 0.6 +/- 0.6%, mPBSC 0.2 +/- 0.1%) [ANOVA: P < 0.0001]. The relative median fluorescence intensity of c-mpl expression was similarly highest in stage I, decreasing through stage IV [ANOVA: P < 0.0001]. No significant differences between tissue sources were observed for either % c-mpl+ cells [P = 0.89] or intensity of c-mpl expression [P = 0.21]. Primary Thy/Liv grafts injected with CD34+38--/dimc-mpl+ cells showed slightly higher levels of donor HLA+ thymocyte reconstitution vs. CD34+38--/dimc-mpl---injected grafts and non-injected controls (c-mpl+ vs. c-mpl--: CD2+ 6.8 +/- 4.5% vs. 2.8 +/- 3.3%, CD4+8-- 54 +/- 35% vs. 31 +/- 29%, CD4--8+ 29 +/- 19% vs. 18 +/- 14%).

Conclusion: These findings support the hypothesis that the TPO receptor, c-mpl, participates in the regulation of primitive human HSC from mid-fetal through adult life. This study extends our previous work documenting human B-lineage, myeloid and CD34+ cell repopulation by c-mpl+ progenitors to show that c-mpl+ HSC/PC are also capable of significant T-lineage reconstitution in vivo. These results suggest that c-mpl merits consideration as a selective surface marker for the identification and isolation of human HSC in both basic research and clinical settings.


Figures

Figure 1
Figure 1
The most primitive CD34+ HSC/PC from all major tissue sources express the highest levels of c-mpl surface receptor. A. Representative CD34-FITC vs. CD38-PE contour plots generated from magnetically selected viable CD34+ mononuclear cells from representative specimens of the four major tissue sources of human HSC/PC: FL, UCB, ABM, and mPBSC. Gates defining the four differentiation stages of human CD34+HSC/PC as defined by Terstappen et al. [6] are shown: I: CD34+38-. II: CD34+38dim III: CD34+38+ IV: CD34dim38+. B. Overlay of the c-mpl-APC histogram plots of viable human CD34+ mononuclear cells from the four HSC/PC differentiation stages depicted in Fig. 1A above. Stage I [red]. Stage II [blue]. Stage III [green]. Stage IV [light blue]. For comparison, a control histogram plot [gray] is shown that is generated from differentiation stage I cells stained with an IgG1 isotype control-APC antibody equivalent in concentration to the c-mpl-APC antibody stain. Isotype control histogram plots for each HSC/PC differentiation stage were used to separately set the manual gates that define the c-mpl+ and c-mpl-- cell populations for each stage. C. CD34-FITC vs. CD38-PE dot plots derived from the same representative human CD34+ tissue specimens as depicted in Fig. 1A. From each specimen, all cell events were initially categorized by their percentile level of fluorescence on the c-mpl-APC parameter on a log histogram plot. Three gates were drawn on the histogram plot to define three discrete levels of c-mpl expression: High (98–100 percentile); Intermediate (48–50 percentile); Low (18–20 percentile). Viable cell events falling within one of these three percentile ranges are depicted on the dot plot with their corresponding color code: High [light blue]; Intermediate [dark blue]; Low [red]. D. Same data as C, but using contour plots to visualize the data. High [red]; Intermediate [yellow]; Low [blue].
Figure 2
Figure 2
The expression of c-mpl is significantly higher in stage I CD34+ HSC/PC and decreases with advancing differentiation stage. A&B. For each specimen from every tissue source, CD34+ cells were plotted with FlowJo® software on a CD34-FITC vs. CD38-PE contour plot, and gates demarcating HSC/PC differentiation stages I through IV [6] were applied (as depicted in Fig. 1A). Cells within each stage were stained with an IgG1 isotype control-APC antibody equivalent in concentration to the c-mpl-APC antibody used. On a log histogram plot of IgG1-APC fluorescence, a c-mpl-- gate was manually drawn to include the left-most 99.5% (± 0.2%) of isotype control-stained cells. A c-mpl+ gate was manually defined to extend from the end of the c-mpl-- gate to the far right of the histogram plot. These gates were defined separately for each HSC/PC differentiation stage for each tissue source, and then applied without alteration to their corresponding c-mpl-APC stained cells within each stage from each tissue. The percentage of cells falling within the c-mpl+ gate was then calculated by the FlowJo® software. Error bars = ± standard error of mean (SEM). C&D. For every specimen, the median fluorescent intensity (MFI) of viable CD34+ cells from each differentiation stage was calculated by FlowJo® software from the log histogram plot of the c-mpl-APC fluorescence parameter. These MFI values for each stage of each tissue specimen were then normalized individually with the appropriate MFI value of the corresponding differentiation stage HSC/PCs stained with the IgG1 isotype control, yielding the Relative MFI (RMFI). Error bars = ± SEM.
Figure 3
Figure 3
The intensity of c-mpl expression can define the most primitive HSC. CD34-FITC vs. CD38-PE smoothed pseudocolor dot plots derived from the same representative human CD34+ ABM and mPBSC specimens as depicted in Fig. 1A. From each specimen, all cell events were initially categorized by their percentile level of fluorescence on the c-mpl-APC parameter on a log histogram plot. Five gates were drawn on the histogram plot to define a progression of five discrete levels of High intensity c-mpl expression: 79–80, 84–85, 89–90, 94–95, and 99–100 percentiles. Viable cell events falling within each percentile range are depicted on the corresponding smoothed dot plot.
Figure 4
Figure 4
Human c-mpl+ HSC/PC have increased T-lineage repopulation capability compared with the corresponding c-mpl-- HSC/PC. Small 1 mm3 fragments of human HLA-B8-- fetal thymus and fetal liver were co-implanted, adjacent to one another, under the renal capsule of scid/scid (SCID) mice, generating one SCID-hu Thy/Liv graft per mouse. Viable, robust 8-week old Thy/Liv grafts (n = 21) were exposed to sublethal irradiation (400 Rads) in vivo, then injected with either 60,000 or 30,000 sorted human HLA-B8+ CD34+CD38--/dimc-mpl+ or CD34+CD38--/dimc-mpl-- ABM cells and allowed to engraft for 8 weeks. Three grafts were reserved as non-injected controls. After 8 weeks, the Thy/Liv grafts were harvested, and single cell suspensions prepared from these grafts were stained with PI and a panel of fluorescent-conjugated antibodies to T-lineage markers and HLA-B8, with all appropriate isotype controls. 100,000 events from each graft were acquired on a FACSCalibur™ flow cytometer. Representative examples of CD34+CD38--/dimc-mpl+-injected grafts (n = 4), CD34+CD38--/dimc-mpl---injected grafts (n = 7), and non-injected grafts (n = 3) are shown. A. Using FlowJo® software, a pseudocolor dot plot of Forward Scatter vs. Side Scatter was generated and a Human Lymphoid Cell Gate was applied to isolate engrafted human mononuclear cell (MNC) events. B. Viable (PI--) human MNC events were then plotted on CD2-PE vs. HLA-B8-APC dot plot, and a CD2-PE+ gate was applied to isolate all viable CD2-PE+ MNC events. C. The total CD2-PE+ MNC events were next plotted on an HLA-B8-APC histogram plot to apply HLA-B8-- and HLA-B8+ gates. The HLA-B8-- and HLA-B8+ gates were generated from the three non-injected Thy/Liv grafts combined. The HLA-B8-- gate was defined to include 99.0% of the left-most viable MNC events of the non-injected grafts on an HLA-B8-APC log histogram plot. The HLA-B8+ gate was drawn from the end of the HLA-B8-- gate to the far right of the histogram plot. The percentage of viable (PI--) CD2-PE+ HLA-B8+ events, out of the total viable CD2-PE+ MNC population, is shown for the representative examples of the three treatment arms. D. CD4-FITC vs. CD8-PE pseudocolor dot plot of viable (PI--) Human Lymphoid Cell gated events. Gates were applied to depict the thymocyte subsets (CD4+CD8+, CD4+CD8--, CD4--CD8+). E. Total viable (PI--) CD4+CD8-- MNC events were plotted on an HLA-B8-APC log histogram plot and the HLA-B8+ gate was applied. The percentage of viable donor-derived CD4+CD8--HLA-B8+ events out of the total viable CD4+CD8-- MNC events is shown for the representative examples of the three treatment arms. F. Total viable (PI--) CD4--CD8+ MNC events were plotted on an HLA-B8-APC log histogram plot, the HLA-B8+ was applied, and the percentage of viable, donor-derived CD4--CD8+HLA-B8+ MNC events out of the total viable CD4--CD8+ MNC population in the Thy/Liv graft was calculated.
Figure 5
Figure 5
Human c-mpl+ HSC/PC show significant repopulation of mature single positive CD4+ and CD8+ thymocytes. SCID-hu Thy/Liv grafts (HLA-B8--; n = 21) were sublethally irradiated and injected with 60,000 or 30,000 sorted HLA-disparate (HLA-B8+) CD34+CD38--/dimc-mpl+ or CD34+CD38--/dimc-mpl-- human ABM cells and allowed to repopulate for 8 weeks. Three grafts were reserved as non-injected controls. The surviving Thy/Liv grafts (c-mpl+ = 4; c-mpl-- = 7; Controls = 3) were harvested and single cell suspensions were stained with PI and fluorescence-conjugated antibodies against T-lineage markers, the HLA-B8 donor marker, and appropriate isotype controls. Events (100,000) were acquired and analyzed using FlowJo® software to determine the percentage of viable (PI--) donor-derived (HLA-B8+) MNC expressing the different T-lineage markers from among all viable MNC expressing that particular marker. Viable (PI--) MNC events from the non-injected Thy/Liv grafts were analyzed to establish the HLA-B8-- gate (representing 99.0% of the left-most events on an HLA-B8-APC log histogram plot) and the HLA-B8+ gate (extending from the end of the HLA-B8-- gate to the far right of the log histogram). These gates were then applied without alteration to the HLA-B8-APC log histogram plots of thymocyte subsets from the c-mpl+ and c-mpl---injected Thy/Liv grafts. A. The mean percentage of viable (PI--) CD2-PE+ HLA-B8+ events, out of the total viable CD2-PE+ MNC population is shown for the non-injected grafts (n = 3), the CD34+CD38--c-mpl---injected grafts (n = 7), and the CD34+CD38--c-mpl+-injected grafts (n = 4). Error bars = ± SEM. B. The mean percentage of viable (PI--) HLA-B8+ donor-derived CD4/CD8 subset thymocytes [CD4+CD8--, CD4--CD8+, CD4+CD8+, CD4--CD8--], out of the respective total thymocyte subset population, is shown for the three treatment arms. Error bars = ± SEM.

Similar articles

Cited by

References

    1. Yin AH, Miraglia S, Zanjani ED, Almeida-Porada G, Ogawa M, Leary AG, Olweus J, Kearney J, Buck DW. AC133, a novel marker for human hematopoietic stem and progenitor cells. Blood. 1997;90:5002–5012. - PubMed
    1. Civin CI, Strauss LC, Brovall C, Fackler MJ, Schwartz JF, Shaper JH. Antigenic analysis of hematopoiesis. III. A hematopoietic progenitor cell surface antigen defined by a monoclonal antibody raised against KG-1a cells. J Immunol. 1984;133:157–165. - PubMed
    1. Krause DS, Fackler MJ, Civin CI, May WS. CD34: structure, biology, and clinical utility. Blood. 1996;87:1–13. - PubMed
    1. DiGiusto D, Chen S, Combs J, Webb S, Namikawa R, Tsukamoto A, Chen BP, Galy AH. Human fetal bone marrow early progenitors for T, B, and myeloid cells are found exclusively in the population expressing high levels of CD34. Blood. 1994;84:421–432. - PubMed
    1. Civin CI, Almeida-Porada G, Lee MJ, Olweus J, Terstappen LW, Zanjani ED. Sustained, retransplantable, multilineage engraftment of highly purified adult human bone marrow stem cells in vivo. Blood. 1996;88:4102–4109. - PubMed