

Longitudinal stability of MRI for mapping brain change using tensor-based morphometry
- PMID: 16480900
- PMCID: PMC1941663
- DOI: 10.1016/j.neuroimage.2005.12.013
Longitudinal stability of MRI for mapping brain change using tensor-based morphometry
Abstract
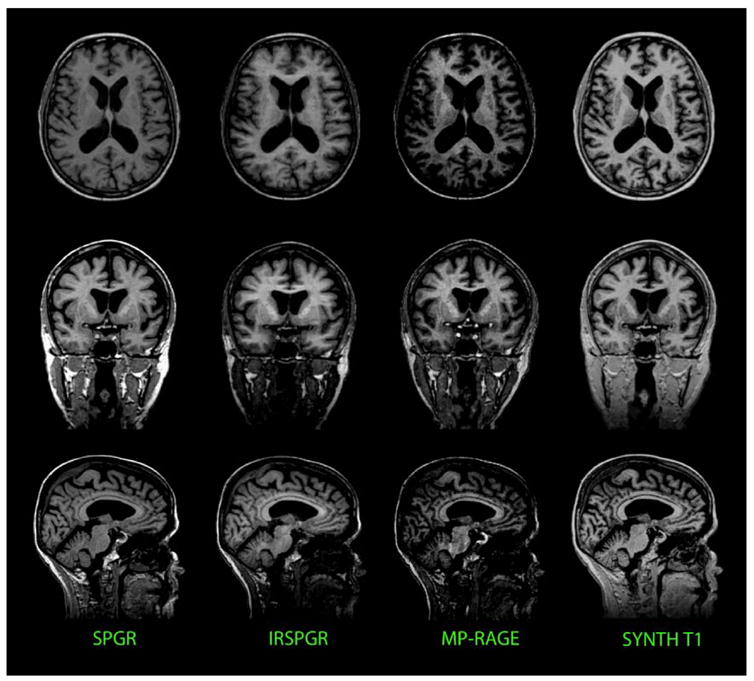
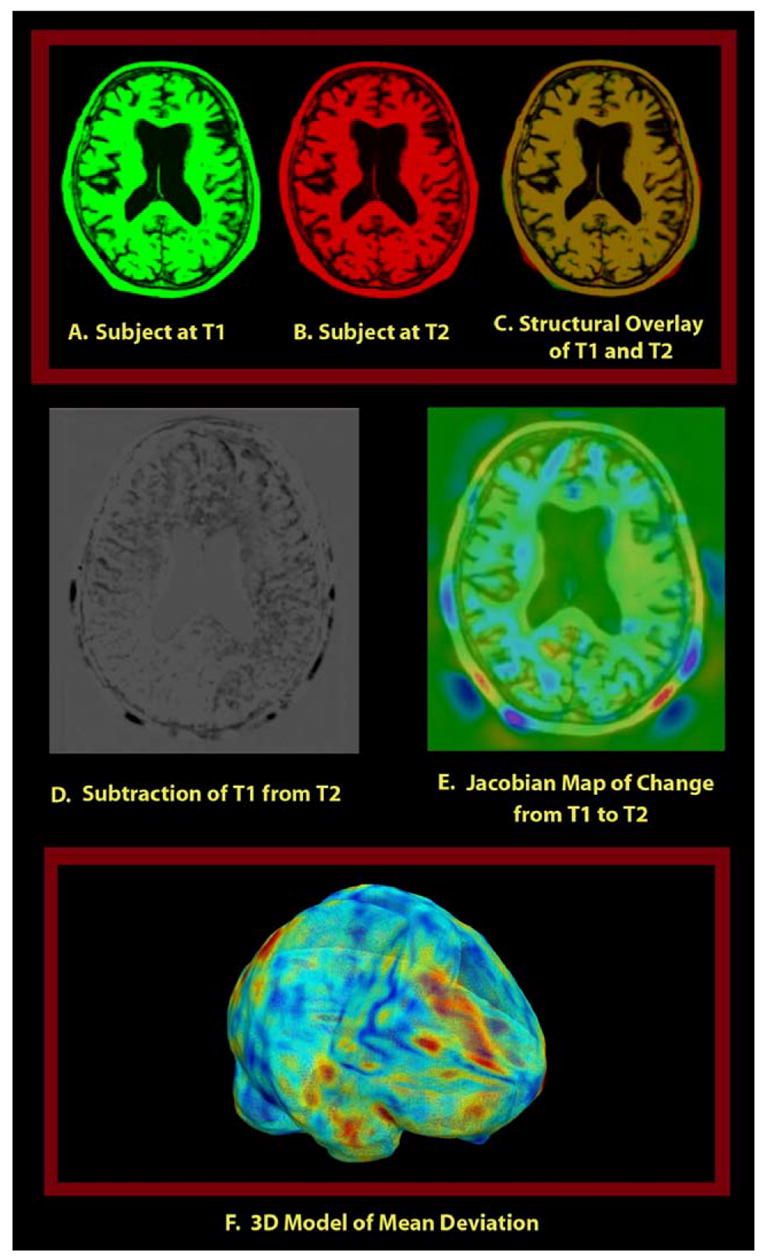
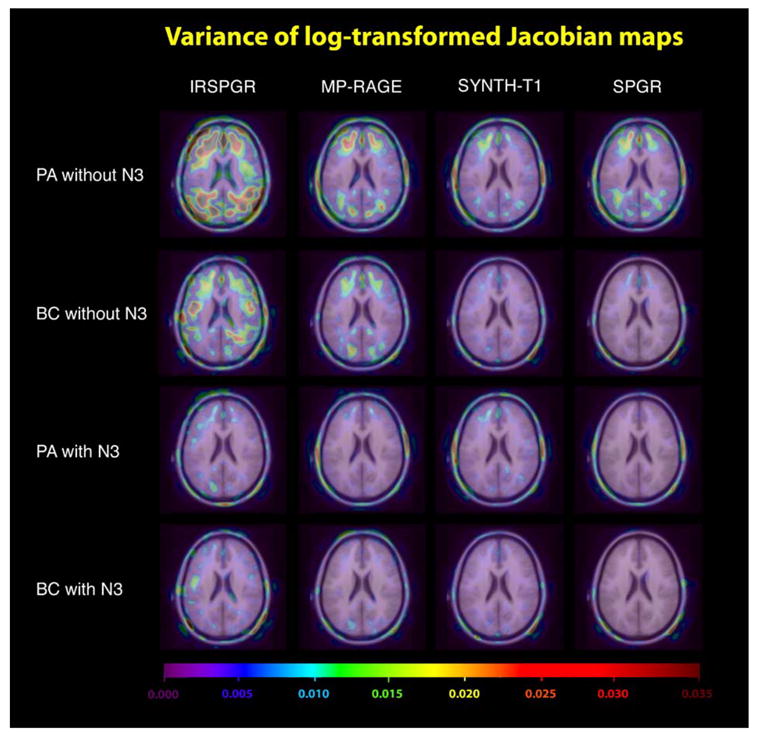
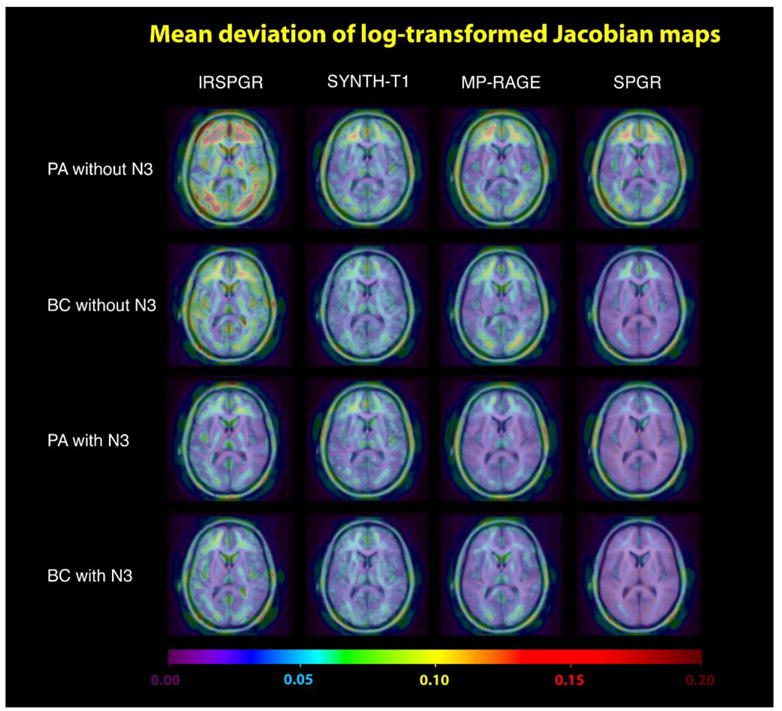
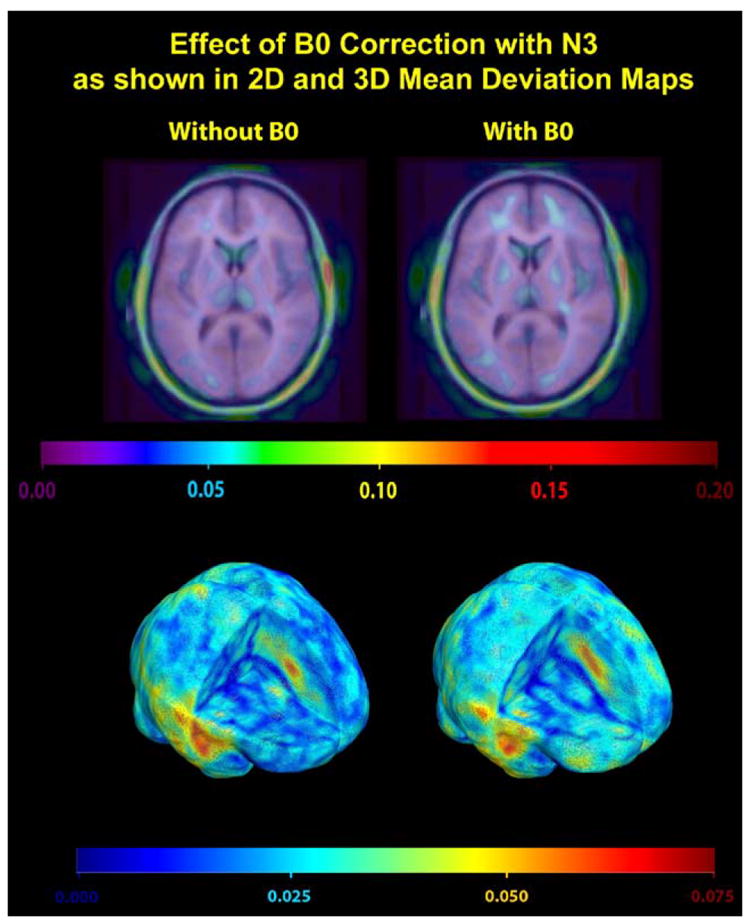
Measures of brain change can be computed from sequential MRI scans, providing valuable information on disease progression, e.g., for patient monitoring and drug trials. Tensor-based morphometry (TBM) creates maps of these brain changes, visualizing the 3D profile and rates of tissue growth or atrophy, but its sensitivity depends on the contrast and geometric stability of the images. As part of the Alzheimer's Disease Neuroimaging Initiative (ADNI), 17 normal elderly subjects were scanned twice (at a 2-week interval) with several 3D 1.5 T MRI pulse sequences: high and low flip angle SPGR/FLASH (from which Synthetic T1 images were generated), MP-RAGE, IR-SPGR (N = 10) and MEDIC (N = 7) scans. For each subject and scan type, a 3D deformation map aligned baseline and follow-up scans, computed with a nonlinear, inverse-consistent elastic registration algorithm. Voxelwise statistics, in ICBM stereotaxic space, visualized the profile of mean absolute change and its cross-subject variance; these maps were then compared using permutation testing. Image stability depended on: (1) the pulse sequence; (2) the transmit/receive coil type (birdcage versus phased array); (3) spatial distortion corrections (using MEDIC sequence information); (4) B1-field intensity inhomogeneity correction (using N3). SPGR/FLASH images acquired using a birdcage coil had least overall deviation. N3 correction reduced coil type and pulse sequence differences and improved scan reproducibility, except for Synthetic T1 images (which were intrinsically corrected for B1-inhomogeneity). No strong evidence favored B0 correction. Although SPGR/FLASH images showed least deviation here, pulse sequence selection for the ADNI project was based on multiple additional image analyses, to be reported elsewhere.
Figures
Similar articles
-
Four-angle method for practical ultra-high-resolution magnetic resonance mapping of brain longitudinal relaxation time and apparent proton density.Magn Reson Imaging. 2020 Feb;66:57-68. doi: 10.1016/j.mri.2019.11.013. Epub 2019 Nov 12. Magn Reson Imaging. 2020. PMID: 31730882 Free PMC article.
-
B1 mapping for bias-correction in quantitative T1 imaging of the brain at 3T using standard pulse sequences.J Magn Reson Imaging. 2017 Dec;46(6):1673-1682. doi: 10.1002/jmri.25692. Epub 2017 Mar 16. J Magn Reson Imaging. 2017. PMID: 28301086
-
Intensity non-uniformity correction using N3 on 3-T scanners with multichannel phased array coils.Neuroimage. 2008 Feb 15;39(4):1752-62. doi: 10.1016/j.neuroimage.2007.10.026. Epub 2007 Oct 30. Neuroimage. 2008. PMID: 18063391 Free PMC article.
-
Scan-Rescan Repeatability and Impact of B0 and B1 Field Nonuniformity Corrections in Single-Point Whole-Brain Macromolecular Proton Fraction Mapping.J Magn Reson Imaging. 2020 Jun;51(6):1789-1798. doi: 10.1002/jmri.26998. Epub 2019 Nov 18. J Magn Reson Imaging. 2020. PMID: 31737961 Free PMC article.
-
Comparison of optimized intensity correction methods for 23Na MRI of the human brain using a 32-channel phased array coil at 7 Tesla.Z Med Phys. 2020 May;30(2):104-115. doi: 10.1016/j.zemedi.2019.10.004. Epub 2019 Dec 19. Z Med Phys. 2020. PMID: 31866116
Cited by
-
Mapping creatinine- and cystatin C-related white matter brain deficits in the elderly.Neurobiol Aging. 2013 Apr;34(4):1221-30. doi: 10.1016/j.neurobiolaging.2012.10.022. Epub 2012 Nov 20. Neurobiol Aging. 2013. PMID: 23182131 Free PMC article.
-
The effect of subsyndromal symptoms of depression and white matter lesions on disability for individuals with mild cognitive impairment.Am J Geriatr Psychiatry. 2013 Sep;21(9):906-14. doi: 10.1016/j.jagp.2013.01.021. Epub 2013 Feb 6. Am J Geriatr Psychiatry. 2013. PMID: 23567388 Free PMC article.
-
Combining boundary-based methods with tensor-based morphometry in the measurement of longitudinal brain change.IEEE Trans Med Imaging. 2013 Feb;32(2):223-36. doi: 10.1109/TMI.2012.2220153. Epub 2012 Sep 21. IEEE Trans Med Imaging. 2013. PMID: 23014714 Free PMC article.
-
Delayed white matter growth trajectory in young nonpsychotic siblings of patients with childhood-onset schizophrenia.Arch Gen Psychiatry. 2012 Sep;69(9):875-84. doi: 10.1001/archgenpsychiatry.2011.2084. Arch Gen Psychiatry. 2012. PMID: 22945617 Free PMC article.
-
Evaluation of both perfusion and atrophy in multiple system atrophy of the cerebellar type using brain SPECT alone.BMC Med Imaging. 2010 Aug 11;10:17. doi: 10.1186/1471-2342-10-17. BMC Med Imaging. 2010. PMID: 20701753 Free PMC article.
References
-
- Ashburner J, Friston KJ. Voxel-based morphometry—The methods. NeuroImage. 2000 Jun;11(6):805–821. Pt 1. - PubMed
-
- Ashburner J, Csernansky J, Davatzikos C, Fox NC, Frisoni G, Thompson PM. Computer-assisted imaging to assess brain structure in healthy and diseased brains. Lancet Neurol. 2003 February;2(2):79–88. - PubMed
-
- Bullmore ET, Suckling J, Overmeyer S, Rabe-Hesketh S, Taylor E, Brammer MJ. Global, voxel, and cluster tests, by theory and permutation, for a difference between two groups of structural MR images of the brain. IEEE Trans Med Imag. 1999;18:32–42. - PubMed
-
- Cachier P, Rey D. Symmetrization of the non-rigid registration problem using inversion-invariant energies: application to multiple sclerosis. Proc MICCAI. 2000:472–481.
Publication types
MeSH terms
Grants and funding
LinkOut - more resources
Full Text Sources
Other Literature Sources
Medical
Research Materials
