. 2006 May;17(5):2223-35.
doi: 10.1091/mbc.e05-08-0749. Epub 2006 Feb 15.

Factors controlling fibroblast growth factor receptor-1's cytoplasmic trafficking and its regulation as revealed by FRAP analysis

Affiliations

Factors controlling fibroblast growth factor receptor-1's cytoplasmic trafficking and its regulation as revealed by FRAP analysis

Star M Dunham-Ems et al. Mol Biol Cell. 2006 May.

Abstract

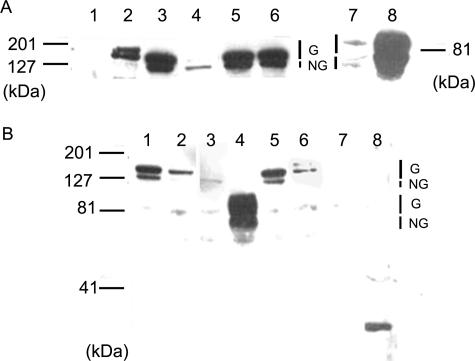
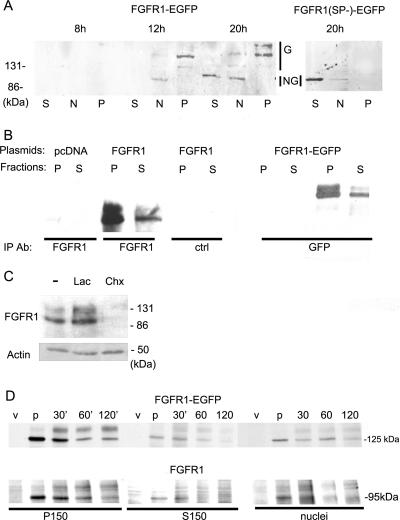
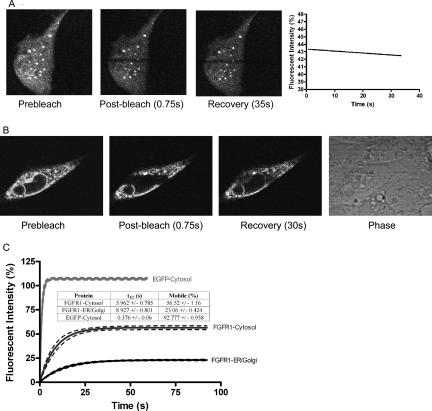
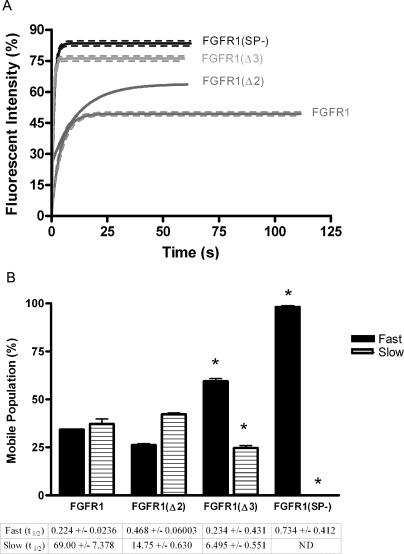
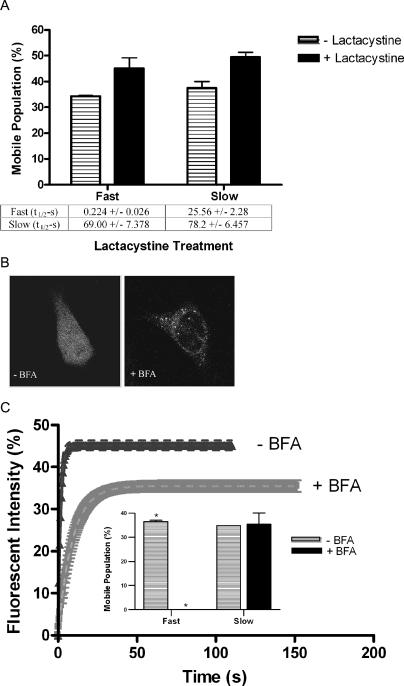
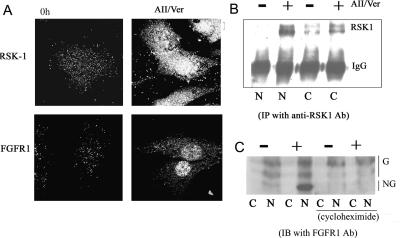
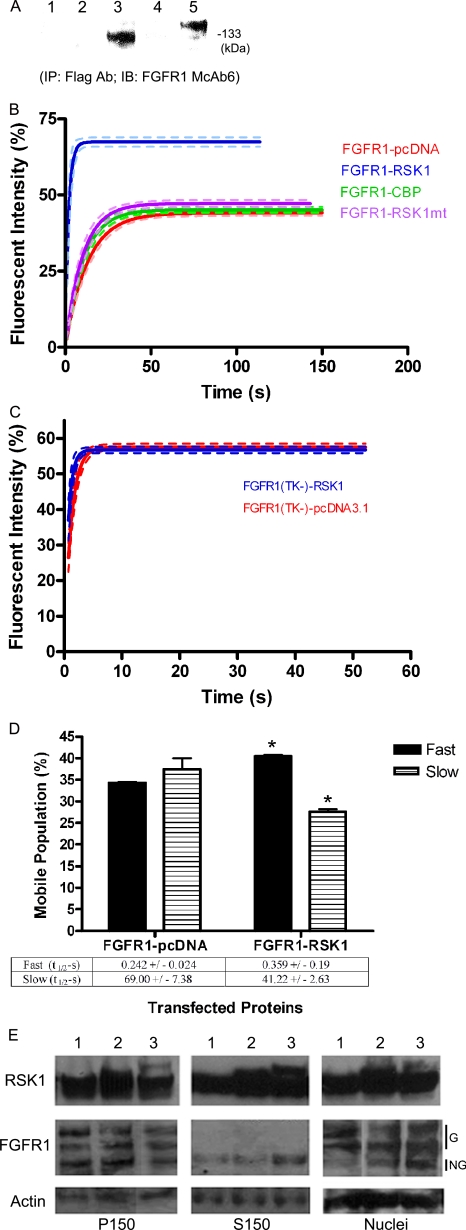
Biochemical and microscopic studies have indicated that FGFR1 is a transmembrane and soluble protein present in the cytosol and nucleus. How FGFR1 enters the cytosol and subsequently the nucleus to control cell development and associated gene activities has become a compelling question. Analyses of protein synthesis, cytoplasmic subcompartmental distribution and movement of FGFR1-EGFP and FGFR1 mutants showed that FGFR1 exists as three separate populations (a) a newly synthesized, highly mobile, nonglycosylated, cytosolic receptor that is depleted by brefeldin A and resides outside the ER-Golgi lumen, (b) a slowly diffusing membrane receptor population, and (c) an immobile membrane pool increased by brefeldin A. RSK1 increases the highly mobile cytosolic FGFR1 population and its overall diffusion rate leading to increased FGFR1 nuclear accumulation, which coaccumulates with RSK1. A model is proposed in which newly synthesized FGFR1 can enter the (a) "nuclear pathway," where the nonglycosylated receptor is extruded from the pre-Golgi producing highly mobile cytosolic receptor molecules that rapidly accumulate in the nucleus or (b) "membrane pathway," in which FGFR1 is processed through the Golgi, where its movement is spatially restricted to trans-Golgi membranes with limited lateral mobility. Entrance into the nuclear pathway is favored by FGFR1's interaction with kinase active RSK1.


Figures

Figure 1.
Figure 1.
Western immunoblot analysis of FGFR1-EGFP fusion proteins in total cell lysates. FGFR1-EGFP and controls were transfected into TE671 cells. Nonglycosylated (NG) and glycosylated receptor forms (G) are indicated. (A) Immunoblotting with FGFR1 McAb6. The lanes correspond to the following transfected plasmids: (1) pcDNA, (2) FGFR1-EGFP, (3) FGFR1(TM)-EGFP, (4) FGFR1(SP)-EGFP, (5) FGFR1(Δ2)-EGFP, (6) FGFR1(Δ3)-EGFP, (7) pcDNA, (8) FGFR1(TK)-EGFP. FGFR1-EGFP predominantly migrated as two hyperglycosylated forms (150 and 160 kDa) and trace amounts of the nonglycosylated (120-kDa) form. FGFR1(Δ2)-EGFP, FGFR1(Δ3)-EGFP, and FGFR1(TM)-EGFP all migrated at 120 and 150 kDa. FGFR1(SP)-EGFP ran as a single band around 120 kDa. (B) Immunoblotting with anti-EGFP. The lanes correspond to the following transfected plasmids: (1) FGFR1(Δ2)-EGFP, (2) FGFR1(Δ3)-EGFP, (3) FGFR(SP)-EGFP, (4) FGFR1(TK)-EGFP, (5) FGFR1(TM)-EGFP, (6) FGFR1-EGFP, (7) pcDNA, (8) EGFP. EGFP migrates at 27 kDa. The EGFP antibody did not detect bands that would indicate expression of EGFP alone or fragments of FGFR1-EGFP proteins from transfected recombinant plasmids.
Figure 2.
Figure 2.
Characterization of FGFR1-EGFP in the S150 soluble cytosolic (S), microsomal membrane P150 (P), and nuclear (N) fractions. (A) TE671 were transfected with FGFR1-EGFP or completely soluble FGFR1 (SP)-EGFP and were analyzed at the indicated times. Immunoblotting performed with anti-FGFR1 McAb6. FGFR1 was not detectable in cells transfected with control pEGFP (unpublished data). FGFR1-EGFP was expressed at 8 h posttransfection. Membrane-associated (150 and 160 kDa), cytosolic and nuclear (120 kDa) FGFR1-EGFP were detected at 12 and 20 h posttransfection (detected with McAb6). (NG) and (G) depict nonglycosylated and different glycosylated forms of receptor, respectively. Subcellular fractions were characterized as described in (Myers et al., 2003) and in the Materials and Methods. (B) Full-length FGFR1 and FGFR1-EGFP are present in the membrane (P) and soluble cytosolic (S) fractions of TE671 cells. Cells were transfected with the indicated plasmids. Cell fractions were immunoprecipitated with a C-terminal FGFR1 antibody, control anti-RNA Polymerase II antibody or an EGFP antibody and immunoblotted with a FGFR1 N-terminal McAb6 antibody. (C) Effect of proteosome or protein synthesis inhibition on cytosolic FGFR1-EGFP. TE671 were transfected with FGFR1-EGFP. Twenty-four hours after transfection some dishes were treated for with lactacystine (Lac: 3 μM, 4 h) or with cycloheximide (Chx: 100 μg/ml, 4 h). Immunoblotting with FGFR1 McAb6 in S150 fraction is shown. (D) Pulse-chase analysis of FGFR1-EGFP and FGFR1. TE671 cells were transfected with FGFR1, FGFR1-EGFP, or with control pcDNA3.1 vector (v) and labeled 24 h later for 1 h with 35S-cysteine + methionine. The cells were rinsed and then either processed immediately (p, pulse) or incubated for 30, 60, or 120 min as described in Materials and Methods. Cell fractions were immunoprecipitated with a GFP (top row) or FGFR1 C-term antibody (bottom row) and analyzed by SDS-PAGE.
Figure 3.
Figure 3.
FRAP analysis of FGFR1-EGFP. A strip across the width of the cell was bleached with high-powered bleach pulse (5–6 mW) and fluorescence was monitored every 0.75 s with a low-powered (20 μW) scanning beam. (A) Images were collected at the indicated time points before and after bleaching of a 4% paraformaldehyde-fixed cell. The plot confirms the absence of recovery in fixed cells (n = 3). Image shows a representative cell. (B) Wild-type FGFR1 distribution and recovery. FGFR1 has a visible specific membrane and soluble distribution. Images were collected at the indicated time points before and after bleaching a cell transfected with w.t. FGFR1-EGFP. Image shows a representative cell. (C) Recovery of specific membranous and soluble populations of w.t. FGFR1-EGFP. In the cytoplasmic regions with identifiable membranous structures, only 25% of the population was mobile, with an average halftime of maximal recovery of 11 s. In the cytoplasm lacking such structures, ∼50% of FGFR1-EGFP was mobile with an average t1/2 = 4 s. Essentially all EGFP molecules showed recovery at t1/2 = 30 s. Data are the mean of at least 13 cells. Plot, solid lines show the mean value and the dashed line is the 95% confidence interval. Inset, table gives the t1/2 and mobile population values obtained from the recovery curves depicted. Errors in table are given as SEM. Differences among FGFR1-EGFP in cytosolic-like compartment, FGFR1-EGFP areas rich in Golgi-ER and nonfused EGFP were statistically significant at p < 0.0001.
Figure 4.
Figure 4.
Recovery of w.t. FGFR1-EGFP and its diffusion rate in the cytoplasm are affected by membrane insertion. Strip FRAP measurements of FGFR1-EGFP are compared with mutants with TMD alterations [FGFR1(Δ2)-EGFP and FGFR1(Δ3)-EGFP] or lacking the signal peptide (FGFR1(SP)-EGFP). (A) One exponential analysis of w.t. FGFR1 and the indicated mutants. Data are the mean of at least six cells. Plot, solid lines show the mean value and the dashed line is the 95% confidence interval. Specific values are given in Table 1. (B) Three distinct populations of FGFR1 are altered due to domain mutations in FGFR1. The same samples were analyzed as in A but with two exponential analysis of w.t. FGFR1 and the indicated mutants. The fast soluble population is represented by the solid bars and the slow membranous population is represented by the dashed bars. The t1/2 values for the fast and slow populations are given in the table below the graph and correspond to the protein directly above the value. ND, not detected. Error in table is given as SEM. Values obtained from strip FRAP measurements (depicted in A) of FGFR1-EGFP, transmembrane mutants (FGFR1(Δ2)-EGFP and FGFR1(Δ3)-EGFP), and SP deletion mutant (FGFR1(SP)-EGFP). The sizes of slow and fast populations of FGFR1 mutants differed significantly compared with w.t. FGFR1 (p < 0.0001). Slow diffusion rates of FGFR1 mutants differed significantly from w.t. FGFR1 (p < 0.001).
Figure 5.
Figure 5.
Intraluminal FGFR1(TM)-EGFP has low mobility. Cells were transfected with FGFR1(TM)-EGFP a nonmembrane protein that accumulates inside the ER vesicles. Arrow points to photobleached cytoplasmic region. Fluorescent intensity is representative of the mobile population. Data are the mean of at least six cells. Specific values are given in Table 1.
Figure 6.
Figure 6.
ER Golgi fusion, but not protein degradation determines FGFR1 dynamics. (A) Proteosomal degradation is not a factor determining FGFR1 mobility characteristics. FGFR1-EGFP was cotransfected with pcDNA. Equal amounts (1 μg) of each plasmid were transfected. Strip FRAP measurements of FGFR1-EGFP-pcDNA3.1 compared with FGFR1-EGFP treated with 3 μM lactacystine for 4 h. Data are the mean at least 12 cells. The sizes of the slow and fast populations of FGFR1-EGFP with or without lactacystine treatment did not differ significantly (p > 0.05). (B) ER Golgi fusion required for soluble and nuclear FGFR1. FGFR1-EGFP was cotransfected with pcDNA. Equal amounts (1 μg) of each plasmid were transfected. Cells were treated for 1 h with brefeldin A (BFA) 24 h posttransfection. Image shows a representative cell. (C) ER Golgi fusion is required for fast, soluble mobility characteristics. FGFR1-EGFP was cotransfected with pcDNA. Equal amounts (1 μg) of each plasmid were transfected. Strip FRAP measurements of FGFR1-EGFP-pcDNA3.1 compared with FGFR1-EGFP treated with 10 μg/ml BFA for 1 h. Fluorescent intensity is representative of the mobile population. Data are the mean at least 14 cells. The fast population is completely eliminated, leaving only 1 mobile population. The inset image displays only the mobile population from two exponential analysis of FGFR1-EGFP with and without BFA treatment. The exact same cells were analyzed in both graphs.
Figure 7.
Figure 7.
RSK1 influences the movement of FGFR1. (A). Coregulation of FGFR1 and RSK1 in BAMC. BAMC were maintained in serum free medium and treated with 0.1 μM angiotensin II and 20 μM veratridine for 0 (control) or 4 h. Cells were fixed, permeabilized with 0.5% Triton X-100, and stained with C-term polyclonal FGFR1 antibody or with anti-phospho-RSK1 antibody. Immune complexes were revealed with secondary antibody fused to Alexa 488. Confocal sections approximately through the middle of the nuclei of the representative cells are shown. Similar results were observed in cells treated with 10 μM forskolin and 0.1 μM PMA (unpublished data). (B) Nuclear and cytoplasmic extracts from control BAMC or BAMC treated with veratridine and angiotensin (AII) for 4 h were immunoprecipitated with a RSK1 antibody and probed with a RSK1 antibody. (C) Nuclear and cytoplasmic extracts from control or stimulated BAMC were subjected to Western blot analysis with FGFR1 antibody. Some cultures were treated with 10 μM cycloheximide for the duration of the experiment (+) as previously described (Stachowiak et al., 1994b).
Figure 8.
Figure 8.
RSK1 influences the cellular trafficking of FGFR1. (A) Coimmunoprecipitation of RSK1 with FGFR1 in TE671 cells. Equal amounts of FGFR1, FGFR1-EGFP were cotransfected with pcDNA or RSK1-flag. The samples were immunoprecipitated with a Flag antibody and immunoblotted with FGFR1 McAb6 or RSK1 antibody. The lanes correspond to the following transfected plasmids: (1) pcDNA + pcDNA, (2) pcDNA + FGFR1, (3) RSK1-Flag + FGFR1, (4) pcDNA + FGFR1-EGFP, and (5) RSK1-Flag + FGFR1-EGFP. (B) Recovery of w.t. FGFR1-EGFP is facilitated by RSK1, but not kinase inactive RSK1. FGFR1-EGFP was cotransfected with pcDNA, or with plasmids expressing CBP, RSK1, or kinase inactive RSK1 (RSKmt) proteins that interact with nuclear or nuclear and cytoplasmic FGFR1, respectively (Hu et al., 2004). Equal amounts (1 μg) of each plasmid were transfected. Strip FRAP measurements of FGFR1-EGFP-pcDNA3.1 compared with FGFR1-EGFP cotransfected with known FGFR1-binding proteins. Fluorescent intensity is representative of the mobile population. Data are the mean at least nine cells. Plot, solid lines show the mean value and the dashed line is the 95% Confidence interval. Specific values are given in Table 2. (C) Mobility of FGFR1(TK)-EGFP is not facilitated by RSK1. FGFR1(TK)-EGFP was cotransfected with pcDNA or with RSK1. Equal amounts (1 μg) of each plasmid were transfected. Strip FRAP measurements of FGFR1(TK)-EGFP-pcDNA3.1 compared with FGFR1(TK)-EGFP cotransfected with RSK1. Fluorescent intensity is representative of the mobile population. Data are the mean at least nine cells. Plot: solid lines show the mean value and the dashed line is the 95% confidence interval. Specific values are given in Table 2. (D) RSK1 increases the fast, soluble population of FGFR1. The fast soluble population is represented by solid bars and the slow membranous population is represented by the dashed bars. The t1/2 values for the fast and slow populations are given in the table below the graph and correspond to the protein directly above the value. Error in table is given as SEM. Values obtained from strip FRAP measurements (depicted C) of FGFR1-EGFP and FGFR1-RSK1. Data are the mean of at least 21 cells. The sizes of the slow and fast populations of FGFR1 differed significantly from that in the presence of RSK1 (p < 0.0001). The slow diffusion rate of FGFR1 also differed significantly in the presence of RSK1 (p < 0.0001), the fast population is below the detection limits of our setup. (E) RSK1 increases the cytosolic and nuclear content of FGFR1 in a kinase-dependent manner. FGFR1 was cotransfected with RSK1, kinase inactive RSK1 (RSKmt), or control pcDNA3.1. The cytosolic, soluble (S150), microsomal (P150), and nuclear fractions were isolated and immunoblotted with FGFR1 McAb6, RSK1, or an actin antibody. The lanes correspond to the following transfected plasmids: (1) pcDNA + FGFR1-EGFP (2) RSK1mt-Flag + FGFR1-EGFP, (3) RSK1-FGFR1-EGFP. NG and G, nonglycosylated and different glycosylated forms of FGFR1-EGFP, respectively.

Similar articles

Cited by

References

    1. Angenstein, F., Greenough, W., and Weiler, I. (1998). Metabotropic glutamate receptor-initiated translocation of protein kinase p90rsk to polyribosomes: a possible factor regulating synaptic protein synthesis. Proc. Natl. Acad. Sci. USA 95, 15078–15083. - PMC - PubMed
    1. Bharali, D. J., Klejbor, I., Stachowiak, E. K., Dutta, P., Roy, I., Kaur, N., Bergey, E. J., Prasad, P. N., and Stachowiak, M. K. (2005). Organically modified silica nanoparticles: a nonviral vector for in vivo gene delivery and expression in the brain. Proc. Natl. Acad. Sci. USA 102, 11539–11544. - PMC - PubMed
    1. Bryant, D. M., Wylie, F. G., and Stow, J. L. (2005). Regulation of endocytosis, nuclear translocation, and signaling of fibroblast growth factor receptor 1 by E-cadherin. Mol. Biol. Cell 16, 14–23. - PMC - PubMed
    1. Carpenter, G. (2003). Nuclear localization and possible functions of receptor tyrosine kinases. Curr. Opin. Cell Biol. 15, 143–148. - PubMed
    1. Catez, F., Brown, D. T., Misteli, T., and Bustin, M. (2002). Competition between histone H1 and HMGN proteins for chromatin binding sites. EMBO Rep. 3, 760–766. - PMC - PubMed

Publication types

MeSH terms

Substances

LinkOut - more resources