. 2006 Feb 15;26(7):2000-9.
doi: 10.1523/JNEUROSCI.3918-05.2006.

Glutamate receptor exocytosis and spine enlargement during chemically induced long-term potentiation

Affiliations

Glutamate receptor exocytosis and spine enlargement during chemically induced long-term potentiation

Charles D Kopec et al. J Neurosci. .

Abstract

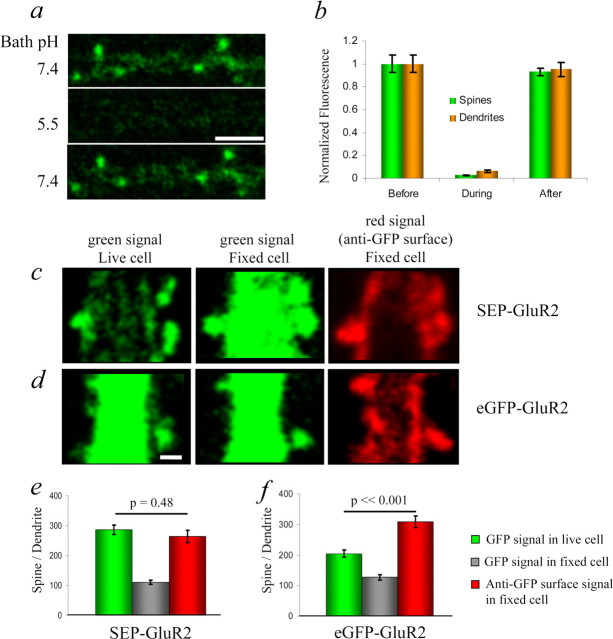
The changes in synaptic morphology and receptor content that underlie neural plasticity are poorly understood. Here, we use a pH-sensitive green fluorescent protein to tag recombinant glutamate receptors and monitor their dynamics onto dendritic spine surfaces. We show that chemically induced long-term potentiation (chemLTP) drives robust exocytosis of AMPA receptors. In contrast, the same stimulus produces a small reduction of NMDA receptors from the spine surface. chemLTP produces similar modification of small and large spines. Interestingly, during chemLTP induction, spines increase in volume before accumulation of AMPA receptors on their surface, indicating that distinct mechanisms underlie changes in morphology and receptor content.


Figures

None
Super ecliptic pHluorin functions to specifically mark surface receptors. a, b, Dissociated hippocampal cultures were infected with Sindbis virus expressing SEP-GluR2 and imaged using two-photon laser-scanning microscopy. Cells were perfused with pH 7.4 ACSF followed by a brief exposure to pH 5.5 and then returned to pH 7.4. a, Representative image of a dendrite and puncta before, during, and after exposure. Images are a single Z-section. b, Quantification of puncta and dendrite intensities before, during, and after exposure normalized to baseline. n = 3 cells, 30 puncta, and 30 dendritic regions. Scale bar, 5 μm. c–f, Organotypic hippocampal CA1 pyramidal cells expressing fluorescent-tagged GluR2 were imaged. The same cells were imaged live, after fixation (nonpermeabilizing conditions), and after immunostained with surface anti-GFP, as indicated. c, Cell expressing SEP-tagged GluR2. d, Cell expressing eGFP-tagged GluR2. e, f, Bar graph of the mean ratio of spine-integrated fluorescence to dendrite mean fluorescence calculated for spine and dendrite box pairs for neurons in several conditions. e, Spine/dendrite for cells expressing SEP-GluR2 (n = 80 spines; 3 cells). f, Spine/dendrite for cells expressing eGFP-GluR2 (n = 47 spines; 3 cells). Scale bar, 1 μm. Error bars represent SEM.
None
Spine enrichment of SEP-tagged receptors is different for each receptor subtype. Spine and dendrite integrated fluorescence collected from CA1 pyramidal cells expressing tDimer dsRed along with SEP-tagged GluR1, GluR2, NR2A, or NR2B. Enrichment is the ratio of spine green/red fluorescence to dendrite green/red fluorescence. a, Ratio images (green/red) of cells expressing tDimer dsRed and indicated SEP-tagged receptor. Blue depicts low receptor density, and red depicts high density. b, Cumulative distribution of enrichment for spines expressing tDimer dsRed along with the indicated SEP-tagged receptor. GFP, n = 188 spines, five cells; GFP-GluR1, n = 136 spines, six cells; GFP-GluR2, n = 122 spines, five cells; SEP-GluR1, n = 200 spines, three cells; SEP-GluR2, n = 175 spines, three cells; SEP-NR2A, n = 220 spines, seven cells; SEP-NR2B, n = 204 spines, five cells. Scale bar, 1 μm.
None
chemLTP mimics tetanus-induced LTP. a, chemLTP (cLTP) drives global bursting and enhances synaptic transmission. Top, Fifteen second periods from simultaneous cell-attached paired recording of a CA1 and CA3 pyramidal neuron before, during, and after chemLTP induction. Six of six paired recordings showed simultaneous activity. Bottom, Field potential recording of evoked synaptic transmission in organotypic hippocampal slice cultures of the CA1 region cell body layer. LTP-inducing solution was applied for 16 min as denoted by the black bar. Field potential amplitudes are plotted for slices exposed to LTP-inducing solution ± APV (−APV, n = 7; +APV, n = 4; p < 0.01). The period of time from 0 to 40 min is not included because of population spikes that prevented accurate measurement of synaptic response. For +APV recordings, APV was present throughout the entire recording period. b, chemLTP drives recombinant GluR1 into synapses. CA1 pyramidal cells infected with Sindbis virus expressing eGFP-GluR1. Evoked EPSC amplitudes were recorded at +40 and −60 mV after 20 min of recovery after chemLTP induction. Rectification denotes the ratio of current (−60/+40 mV; GluR1, n = 15; control, n = 15; p = 0.01). c, d, chemLTP (cLTP) drives spine growth. c, CA1 hippocampal pyramidal neurons expressing tDimer dsRed and SEP-GluR1 (green channel not shown) via biolistic transfection. Images taken at −30 min and +40 min relative to the induction of chemLTP either ±APV are shown. Scale bar, 1 μm. d, Mean integrated spine red fluorescence from cells in c. The black bar denotes chemLTP induction. *p < 0.01 compared with baseline values. −APV, n = 200 spines, three cells; +APV, n = 181 spines, three cells. Error bars represent SEM.
None
chemLTP drives SEP-GluR1 and SEP-GluR2 onto dendritic spines. a–c, CA1 pyramidal cells expressing tDimer dsRed and SEP-GluR1. a, Ratio images (green receptor/red volume) at −30 and +40 min relative to chemLTP induction. b, Integrated red (volume) and green (receptor) fluorescence for spines and dendrites (n = 200 spines, 3 cells). Each region of interest is normalized to its value at the −10 min time point. The black bar denotes chemLTP (cLTP) induction. *p < 0.01 relative to baseline. c, Spine integrated receptor and volume during chemLTP (cLTP) induction imaged every 2 min. n = 144 spines, four cells. Dendrite receptor ± chemLTP-inducing drugs (+chemLTP, n = 144 regions, 4 cells; −chemLTP, n = 34 regions, 5 cells). Values normalized as in b. d, e, Cells expressing tDimer dsRed and SEP-GluR2. d, Ratio images (green receptor/red volume) at −30 and +40 min relative to chemLTP induction. e, Integrated red (volume) and green (receptor) fluorescence for spines and dendrites (n = 175 spines; 3 cells) normalized as in b. *p < 0.01. Scale bar, 1 μm. Error bars represent SEM.
None
chemLTP removes spine SEP-NR2B but not SEP-NR2A. a–c, Cells expressing tDimer dsRed and SEP-NR2B. a, Ratio images (green receptor/red volume) at −30 and +40 min relative to chemLTP induction. b, Integrated red (volume) and green (receptor) fluorescence for spines (n = 204 spines; 5 cells) normalized as in Figure 4. *p < 0.01. c, Initial spine NR2B density verses spine Δ volume as in c. Scale bar, 1 μm. d–f, CA1 pyramidal cells expressing tDimer dsRed and SEP-NR2A. d, Ratio images (green receptor/red volume) at −30 and +40 min relative to chemLTP induction. e, Integrated red (volume) and green (receptor) fluorescence for spines (n = 220 spines; 7 cells). Normalization is as in Figure 4. The black bar denotes chemLTP induction. *p < 0.01. f, Initial spine NR2A density (mean green baseline −30 and −10 min/mean red baseline −30 and −10 min) verses spine Δ volume [mean red after (+5, +40, and +70 min) − mean red before (−30 and −10 min)]. cLTP, chemLTP. Error bars represent SEM.
None
Changes in spine receptor and spine volume during chemLTP. a, Cumulative frequency distribution for spine Δ receptor for cells expressing SEP-tagged GluR1, GluR2, NR2A, and NR2B. Δ Receptor defined as spine-integrated green (mean of fluorescence at +5, +40, and +70 min values)/spine-integrated green (mean of fluorescence at −30 and −10 min). All time points relative to chemLTP induction are shown. b, Cumulative frequency distribution for spine Δ volume. Analysis is as in a using spine red fluorescence. cLTP, chemLTP.
None
Spine enhancement is independent of initial spine size. a, Example images of small, medium, and large spines before and after chemLTP induction. Scale bar, 1 μm. b, Spine absolute Δ volume for all cells during chemLTP, normalized as in a. Absolute Δ volume = (mean of volume at +5, +40, and +70 min) − (mean of volume at −30 and −10 min). c, Spine fold Δ volume for all cells during chemLTP. Each spine is normalized by mean initial volume for each cell. Fold Δ volume = (mean of fluorescence at +5, +40, and +70 min)/(mean of fluorescence at −30 and −10 min). No data from cells expressing SEP-GluR2 were used in this analysis, because spines on those cells had a slightly reduced basal volume. n = 15 cells. d, Model of volume increase before receptor exocytosis during chemLTP. Error bars represent SEM.

References

    1. Anderson RGFJ, Goldstein JL, Brown MS (1984). Visualization of acidic organelles in intact cells by electron microscopy. Proc Natl Acad Sci USA 81:4838–4842. - PMC - PubMed
    1. Arnold D, Feng L, Kim J, Heintz N (1994). A strategy for the analysis of gene expression during neural development. Proc Natl Acad Sci USA 91:9970–9974. - PMC - PubMed
    1. Ashby MCDLRS, Ralph GS, Uney J, Collingridge GL, Henley JM (2004). Removal of AMPA receptors (AMPARs) from synapses is preceded by transient endocytosis of extrasynaptic AMPARs. J Neurosci 24:5172–5176. - PMC - PubMed
    1. Barria A, Malinow R (2002). Subunit-specific NMDA receptor trafficking to synapses. Neuron 35:345–353. - PubMed
    1. Barria A, Malinow R (2005). NMDA receptor subunit composition controls synaptic plasticity by regulating binding to CaMKII. Neuron 48:289–301. - PubMed

Publication types