Acceleration of age-related hearing loss by early noise exposure: evidence of a misspent youth
- PMID: 16481444
- PMCID: PMC1855187
- DOI: 10.1523/JNEUROSCI.4985-05.2006
Acceleration of age-related hearing loss by early noise exposure: evidence of a misspent youth
Abstract
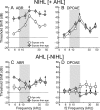
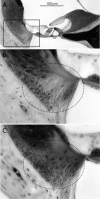
Age-related and noise-induced hearing losses in humans are multifactorial, with contributions from, and potential interactions among, numerous variables that can shape final outcome. A recent retrospective clinical study suggests an age-noise interaction that exacerbates age-related hearing loss in previously noise-damaged ears (Gates et al., 2000). Here, we address the issue in an animal model by comparing noise-induced and age-related hearing loss (NIHL; AHL) in groups of CBA/CaJ mice exposed identically (8-16 kHz noise band at 100 dB sound pressure level for 2 h) but at different ages (4-124 weeks) and held with unexposed cohorts for different postexposure times (2-96 weeks). When evaluated 2 weeks after exposure, maximum threshold shifts in young-exposed animals (4-8 weeks) were 40-50 dB; older-exposed animals (> or =16 weeks) showed essentially no shift at the same postexposure time. However, when held for long postexposure times, animals with previous exposure demonstrated AHL and histopathology fundamentally unlike unexposed, aging animals or old-exposed animals held for 2 weeks only. Specifically, they showed substantial, ongoing deterioration of cochlear neural responses, without additional change in preneural responses, and corresponding histologic evidence of primary neural degeneration throughout the cochlea. This was true particularly for young-exposed animals; however, delayed neuropathy was observed in all noise-exposed animals held 96 weeks after exposure, even those that showed no NIHL 2 weeks after exposure. Data suggest that pathologic but sublethal changes initiated by early noise exposure render the inner ears significantly more vulnerable to aging.
Figures


Similar articles
-
Candidate's thesis: enhancing intrinsic cochlear stress defenses to reduce noise-induced hearing loss.Laryngoscope. 2002 Sep;112(9):1515-32. doi: 10.1097/00005537-200209000-00001. Laryngoscope. 2002. PMID: 12352659
-
The effect of an age-related hearing loss gene (Ahl) on noise-induced hearing loss and cochlear damage from low-frequency noise.Hear Res. 2005 Jun;204(1-2):90-100. doi: 10.1016/j.heares.2005.01.004. Hear Res. 2005. PMID: 15925194
-
Divergence of noise vulnerability in cochleae of young CBA/J and CBA/CaJ mice.Hear Res. 2011 Feb;272(1-2):13-20. doi: 10.1016/j.heares.2010.11.006. Epub 2010 Nov 23. Hear Res. 2011. PMID: 21108998 Free PMC article.
-
Genetic influences on susceptibility of the auditory system to aging and environmental factors.Scand Audiol Suppl. 1992;36:1-39. Scand Audiol Suppl. 1992. PMID: 1488615 Review.
-
[Genetic factors in susceptibility to age- and noise-related hearing loss].Pol Merkur Lekarski. 2006 Oct;21(124):384-8. Pol Merkur Lekarski. 2006. PMID: 17205784 Review. Polish.
Cited by
-
Physiological changes throughout an insect ear due to age and noise - A longitudinal study.iScience. 2022 Jul 21;25(9):104746. doi: 10.1016/j.isci.2022.104746. eCollection 2022 Sep 16. iScience. 2022. PMID: 36034233 Free PMC article.
-
The everyday acoustic environment and its association with human heart rate: evidence from real-world data logging with hearing aids and wearables.R Soc Open Sci. 2021 Feb 17;8(2):201345. doi: 10.1098/rsos.201345. R Soc Open Sci. 2021. PMID: 33972852 Free PMC article.
-
Sex-Linked Biology and Gender-Related Research Is Essential to Advancing Hearing Health.Ear Hear. 2023 Jan-Feb 01;44(1):10-27. doi: 10.1097/AUD.0000000000001291. Epub 2022 Nov 17. Ear Hear. 2023. PMID: 36384870 Free PMC article. Review.
-
Application of Mouse Models to Research in Hearing and Balance.J Assoc Res Otolaryngol. 2016 Dec;17(6):493-523. doi: 10.1007/s10162-016-0589-1. Epub 2016 Oct 17. J Assoc Res Otolaryngol. 2016. PMID: 27752925 Free PMC article. Review.
-
Optimizing Auditory Brainstem Response Acquisition Using Interleaved Frequencies.J Assoc Res Otolaryngol. 2020 Jun;21(3):225-242. doi: 10.1007/s10162-020-00754-3. Epub 2020 Jul 9. J Assoc Res Otolaryngol. 2020. PMID: 32648066 Free PMC article.
References
-
- Adams JC (2002). Clinical implications of inflammatory cytokines in the cochlea: a technical note. Otol Neurotol 23:316–322. - PubMed
-
- American College of Occupational Medicine. (1989). Occupational noise-induced hearing loss. ACOM Noise and Hearing Conservation Committee. J Occup Med 31:996–1001. - PubMed
-
- Bock GR, Saunders JC (1977). A critical period for acoustic trauma in the hamster and its relation to cochlear development. Science 197:396–398. - PubMed
-
- Bock GR, Seifter EJ (1978). Developmental changes of susceptibility to auditory fatigue in young hamsters. Audiology 17:193–203. - PubMed
-
- Candreia C, Martin GK, Stagner BB, Lonsbury-Martin BL (2004). Distortion product otoacoustic emissions show exceptional resistance to noise exposure in MOLF/Ei mice. Hear Res 194:109–117. - PubMed
Publication types
MeSH terms
Grants and funding
LinkOut - more resources
Full Text Sources
Other Literature Sources
Medical
Miscellaneous
