Comparative Study
. 2006 Mar 1;20(5):543-56.
doi: 10.1101/gad.1407406. Epub 2006 Feb 15.

Distinct roles for cysteine cathepsin genes in multistage tumorigenesis

Affiliations
Comparative Study

Distinct roles for cysteine cathepsin genes in multistage tumorigenesis

Vasilena Gocheva et al. Genes Dev. .

Abstract

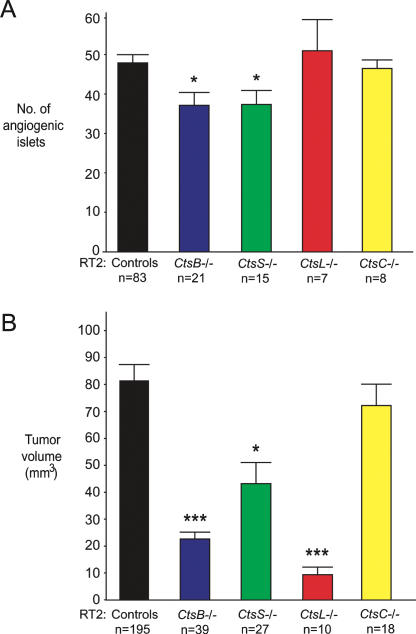
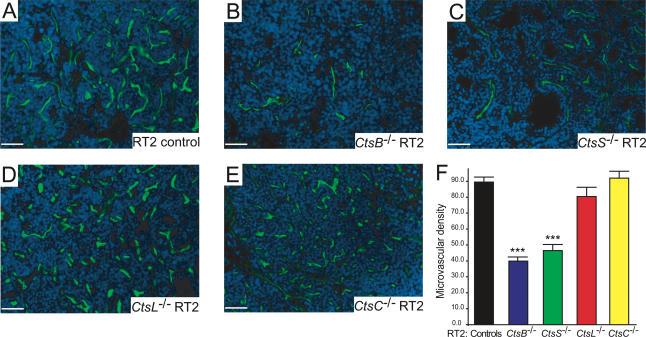
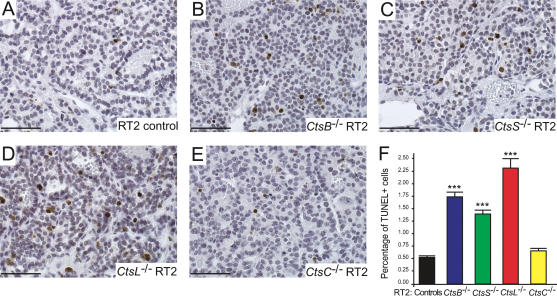
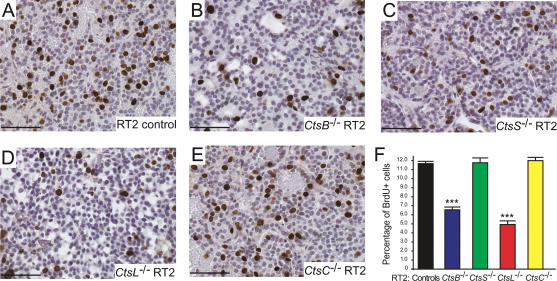
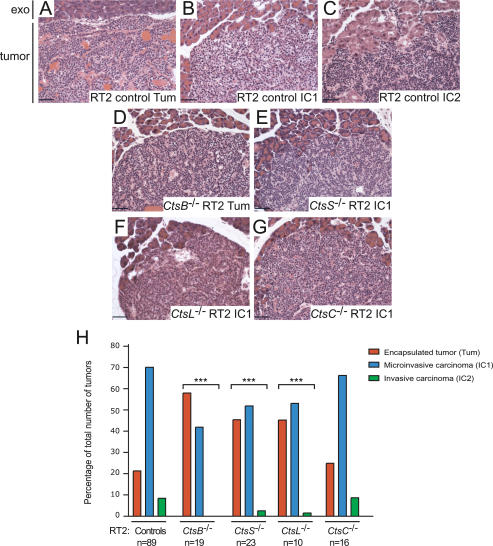
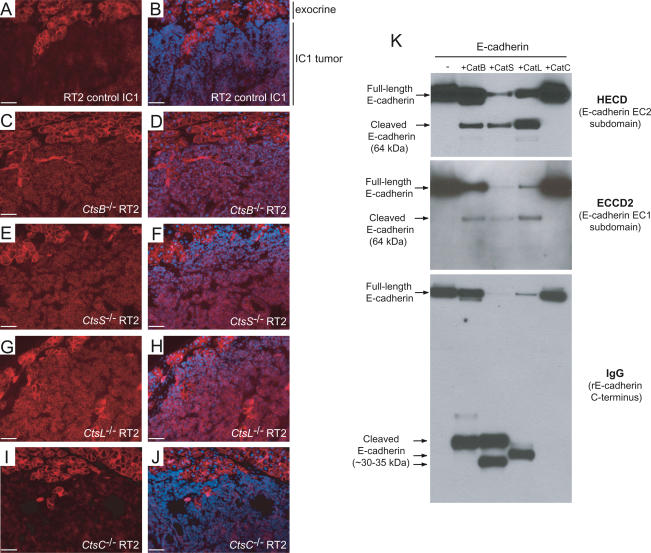
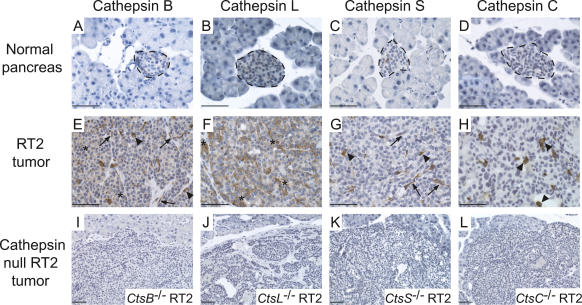
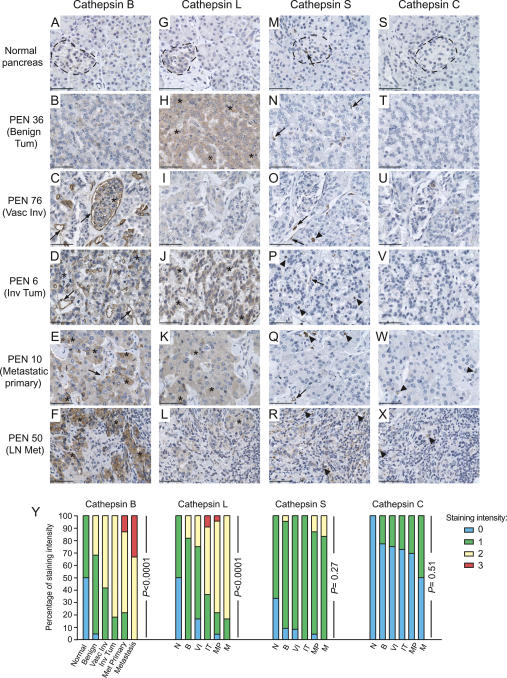
Multiple types of degradative enzymes, including cathepsins of the cysteine protease family, have been implicated in the regulation of angiogenesis and invasion during cancer progression. Several cysteine cathepsins are up-regulated in a mouse model of pancreatic islet cell carcinogenesis (RIP1-Tag2), and tumor progression is impaired following their collective pharmacologic inhibition. Using null mutations of four of the implicated cysteine cathepsins, we have now dissected their individual roles in cancer development. Mutants of cathepsins B or S impaired tumor formation and angiogenesis, while cathepsin B or L knockouts retarded cell proliferation and tumor growth. Absence of any one of these three genes impaired tumor invasion. In contrast, removal of cathepsin C had no effect on either tumor formation or progression. We have identified E-cadherin as a target substrate of cathepsins B, L, and S, but not cathepsin C, potentially explaining their differential effects on tumor invasion. Furthermore, we detected analogous increases in cathepsin expression in human pancreatic endocrine neoplasms, and a significant association between increased levels of cathepsins B and L and tumor malignancy. Thus individual cysteine cathepsin genes make distinctive contributions to tumorigenesis.


Figures

Figure 1.
Figure 1.
Differential effects of cysteine cathepsin knockouts on angiogenic switching and tumor growth. (A) Angiogenic switching was assessed in RIP1-Tag2 (RT2) mice at 10.5 wk of age by counting the number of angiogenic islets from each individual pancreas and comparing cathepsin knockout RT2 mice to RT2 littermate controls (cathepsin +/+ and +/− littermates) of the same age. (B) The cumulative tumor volume for all tumors in the pancreas was calculated for each RT2 mouse at 13.5 wk of age and grouped by genotype. In both graphs, the means and standard errors are shown, and P values were calculated by comparison to the RT2 littermate control group, using the Wilcoxon t-test; (***) P value of <0.0001; (*) P value of <0.01. The numbers of mice evaluated are indicated below each genotype.
Figure 2.
Figure 2.
Deletion of cathepsins B or S reduces tumor vascularization. FITC-lectin injection was used to visualize the functional vasculature in tumors from wild-type control RT2 (A), CtsB−/− RT2 (B), CtsS−/− RT2 (C), CtsL−/− RT2 (D), and CtsC−/− RT2 (E) mice, treated under identical conditions. Representative FITC/DAPI merged images from each genotype are shown (FITC: green; DAPI: blue). (F) The MVD was calculated by counting the number of vessels per field of each tumor in each mouse analyzed. The total numbers of fields scored are as follows: RT2 controls: 75 fields from nine mice; CtsB−/− RT2: 70 fields from nine mice; CtsS−/− RT2: 41 fields from seven mice; CtsL−/− RT2: 25 fields from four mice; CtsC−/− RT2: 37 fields from three mice. The “controls” column corresponds to both +/+ and +/− RT2 littermates generated from the four cathepsin mutant/RT2 crosses. The means and standard errors are shown, and P values were calculated by comparison to the RT2 littermate control group using the Wilcoxon t-test; (***) P value of <0.0001. Bars, 50 μm.
Figure 3.
Figure 3.
Deletion of cathepsins B, L, or S significantly increases tumor cell death. TUNEL staining was used to visualize apoptotic cells in tumors from control RT2 (A), CtsB−/− RT2 (B), CtsS−/− RT2 (C), CtsL−/− RT2 (D), and CtsC−/− RT2 (E) mice, stained under identical conditions. Positive cells are stained in brown, and hematoxylin (blue) is used as a counterstain. Representative images from each genotype are shown. (F) The percentage of apoptotic (TUNEL+) cells was calculated from several fields of each tumor in each mouse analyzed, and the means and standard errors are shown for each genotype. The total numbers of fields scored are as follows: RT2 controls: 209 fields from 21 mice; CtsB−/− RT2: 94 fields from 10 mice; CtsS−/− RT2: 122 fields from 12 mice; CtsL−/− RT2: 36 fields from four mice; CtsC−/− RT2: 86 fields from eight mice. The “controls” column corresponds to both +/+ and +/− RT2 littermates generated from the four cathepsin mutant/RT2 crosses. The means and standard errors are shown, and P values were calculated by comparison to the RT2 littermate control group using the Wilcoxon t-test; (***) P value of <0.0001. Bars, 50 μm.
Figure 4.
Figure 4.
Mice mutant for cathepsins B or L, but not S and C, show decreases in tumor cell proliferation. BrdU staining was used to visualize proliferating cells in tumors from control RT2 (A), CtsB−/− RT2 (B), CtsS−/− RT2 (C), CtsL−/− RT2 (D), and CtsC−/− RT2 (E) mice, stained under identical conditions. Positive cells are stained in brown, and hematoxylin (blue) is used as a counterstain. Representative images from each genotype are shown. (F) The percentage of proliferating (BrdU+) cells was calculated from several fields per tumor in each mouse analyzed, and the means and standard errors are shown for each genotype. The total numbers of fields scored are as follows: RT2 controls: 255 fields from 19 mice; CtsB−/− RT2: 81 fields from seven mice; CtsS−/− RT2: 51 fields from five mice; CtsL−/− RT2: 33 fields from three mice; CtsC−/− RT2: 69 fields from five mice. The “controls” column corresponds to both +/+ and +/− RT2 littermates generated from the four cathepsin mutant/RT2 crosses. The means and standard errors are shown, and P values were calculated by comparison to the RT2 littermate control group using the Wilcoxon t-test; (***) P value of <0.0001. Bars, 50 μm.
Figure 5.
Figure 5.
Deletion of cathepsins B, L, or S, but not C, impairs tumor invasion. H&E staining was used to grade tumors from cathepsin knockout RT2 mice and RT2 littermate controls. Tumors in RT2 mice can be divided into three different classes, as shown in representative H&E images from control RT2 mice: (A) Encapsulated tumors (Tum). (B) Microinvasive carcinomas (IC1). (C) Invasive carcinomas (IC2). Representative images for the predominant grade of tumors in cathepsin knockout/RT2 mice are indicated. (D) CtsB−/− RT2: Tum. (E) CtsS−/− RT2: IC1. (F) CtsL−/− RT2: IC1. (G) CtsC−/− RT2: IC1. In all H&E panels, the normal exocrine tissue (exo) is shown at the top of the image for comparison to the tumor below. (H) Graph showing the relative proportions of encapsulated, microinvasive, and invasive carcinomas in RT2 controls versus the different cathepsin knockout/RT2 mice at 13.5 wk of age. The “controls” column corresponds to both +/+ and +/− RT2 littermates generated from the four cathepsin mutant/RT2 crosses. The total numbers of tumors scored are as follows: controls: 1416 tumors from 89 mice; CtsB−/− RT2: 269 tumors from 19 mice; CtsS−/− RT2: 277 tumors from 23 mice; CtsL/- RT2: 64 tumors from 10 mice; CtsC−/− RT2: 288 tumors from 16 mice. The distribution of tumor types in the control group was compared with the distribution of tumors in the other four groups using a cumulative logit model with generalized estimating equations to correct for correlations within individual mice. (***) P value of <0.0001 compared with the controls group using this test. Bars, 50 μm.
Figure 6.
Figure 6.
E-cadherin is a target substrate for cathepsins B, L, or S, but not C, in vivo and in vitro. E-cadherin staining was used to confirm the H&E grading and revealed a consistent maintenance of E-cadherin levels even in microinvasive carcinomas (IC1) from CtsB−/− RT2 (C,D), CtsS−/− RT2 (E,F), and CtsL−/− RT2 (G,H) mice, but not in CtsC−/− RT2 (I,J) or control RT2 (A,B) IC1 tumors. E-cadherin-stained images (red) are shown in the left panels, with E-cadherin/DAPI merged images in the right panels. The normal exocrine tissue (in which levels of E-cadherin are the same in all genotypes) is shown at the top of the image for comparative reference to the IC1 tumor below. Bars, 50 μm. (K) Recombinant E-cadherin is cleaved by cathepsins B, L, and S, but not cathepsin C in vitro. E-cadherin was incubated under identical conditions with each activated cathepsin, as indicated above the top panel, and Western blots were hybridized with HECD-1 (E-cadherin extracellular subdomain EC2), ECCD2 (extracellular subdomain EC1), or IgG (to detect recombinant E-cadherin, which has an IgG linker at the C terminus). Full-length and cleaved E-cadherin fragments are indicated at the left side.
Figure 7.
Figure 7.
Cell-type-specific expression of cathepsins in mouse RT2 pancreatic tumors. Normal pancreas and RT2 tumors were stained with antibodies against cathepsins B, L, S, and C as indicated. (AD) Representative images of normal mouse pancreas stained for each antibody are shown in the first row, with normal islets indicated with a dotted black line, surrounded by normal exocrine cells. (EH) Representative images of RT2 tumors stained for each antibody are shown in the second row. Cathepsin-positive cells are stained in brown, and hematoxylin (blue) was used as a counterstain. Tumor cell staining is indicated by asterisks, endothelial cell staining by arrows, and immune cell staining by arrowheads. (IL) The specificity of antibodies against cathepsins B, C, L, and S is demonstrated by the absence of staining in the corresponding cathepsin-null/RT2 tumors, as indicated in the third row. Bars, 50 μm.
Figure 8.
Figure 8.
Increased levels of cathepsins B and L are positively associated with tumor progression in human PEN lesions and associated metastases. A TMA was constructed from a panel of human PEN and normal pancreas tissues. (AX) Tissue arrays were stained with antibodies against cathepsins B, L, S, and C as indicated. Cathepsin-positive cells are stained in brown, and hematoxylin (blue) was used as a counterstain. Representative images of normal human pancreas (n = 6) stained for each antibody are shown in the first row, with normal islets indicated with a dotted black line, surrounded by normal exocrine cells. Representative images for each of the tumor stages—Benign Tumor (n = 22), Vascular Invasive Tumor (n = 12), Invasive Tumor (n = 11), Metastatic Primary (n = 23), and Metastasis (n = 6)—are shown in the rows below. The PEN number corresponds to the position on the tissue array. Tumor cell staining is indicated by asterisks, endothelial cell staining by arrows, and immune cell staining by arrowheads. (Y) The cathepsin staining for each tissue specimen was scored as negative (0) or positive [three levels: weak (1); moderate (2); strong (3)] and graphed as the percentage of staining intensity for each stage. For each cathepsin, an overall test of differences among any of the groups (normal and tumor) was performed. An exact version of Mantel Haenszel’s test for trend was performed to look for differences in staining in each tumor group compared with the normal controls and to calculate P values, which are shown next to each data set. Bars, 50 μm.

References

    1. Balaji K.N, Schaschke N, Machleidt W, Catalfamo M, Henkart P.A. Surface cathepsin B protects cytotoxic lymphocytes from self-destruction after degranulation. J. Exp. Med. 2002;196:493–503. - PMC - PubMed
    1. Beavon I.R. The E-cadherin–catenin complex in tumour metastasis: Structure, function and regulation. Eur. J. Cancer. 2000;36(13 Spec No):1607–1620. - PubMed
    1. Bergers G, Song S, Meyer-Morse N, Bergsland E, Hanahan D. Benefits of targeting both pericytes and endothelial cells in the tumor vasculature with kinase inhibitors. J. Clin. Invest. 2003;111:1287–1295. - PMC - PubMed
    1. Camp R.L, Charette L.A, Rimm D.L. Validation of tissue microarray technology in breast carcinoma. Lab. Invest. 2000;80:1943–1949. - PubMed
    1. Cavallaro U, Christofori G. Cell adhesion and signalling by cadherins and Ig-CAMs in cancer. Nat. Rev. Cancer. 2004;4:118–132. - PubMed

Publication types

MeSH terms