. 2006 Feb 28;103(9):3393-8.
doi: 10.1073/pnas.0507825103. Epub 2006 Feb 15.

Impact of behavior on central and peripheral circadian clocks in the common vole Microtus arvalis, a mammal with ultradian rhythms

Affiliations

Impact of behavior on central and peripheral circadian clocks in the common vole Microtus arvalis, a mammal with ultradian rhythms

Daan R van der Veen et al. Proc Natl Acad Sci U S A. .

Abstract

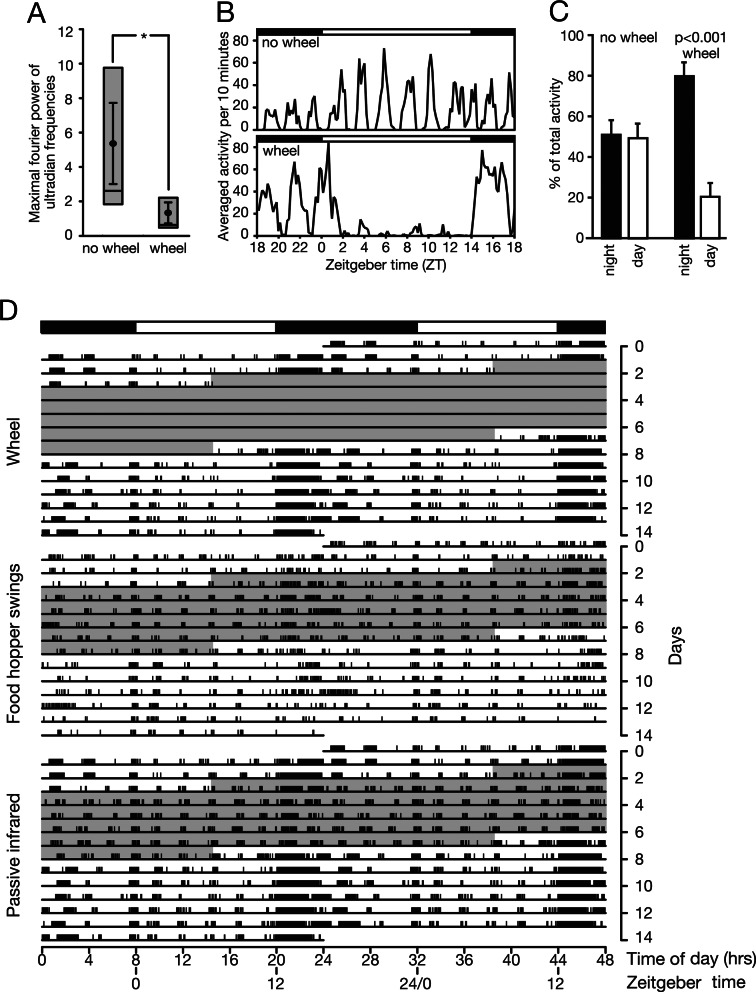
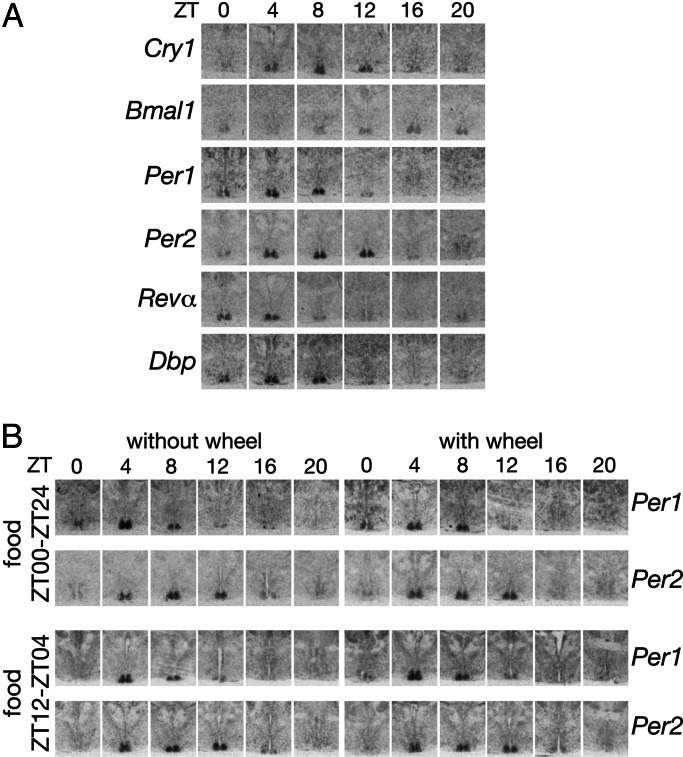
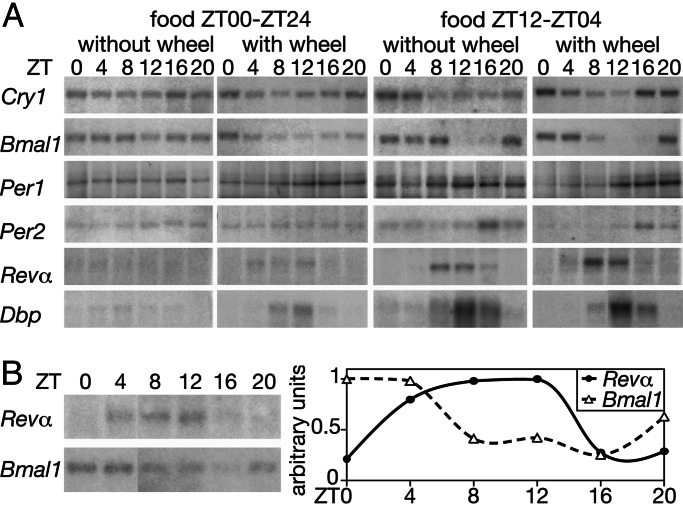
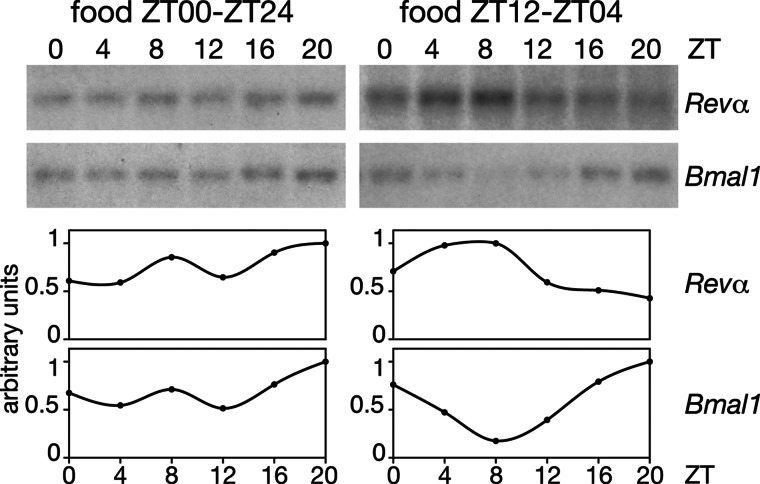
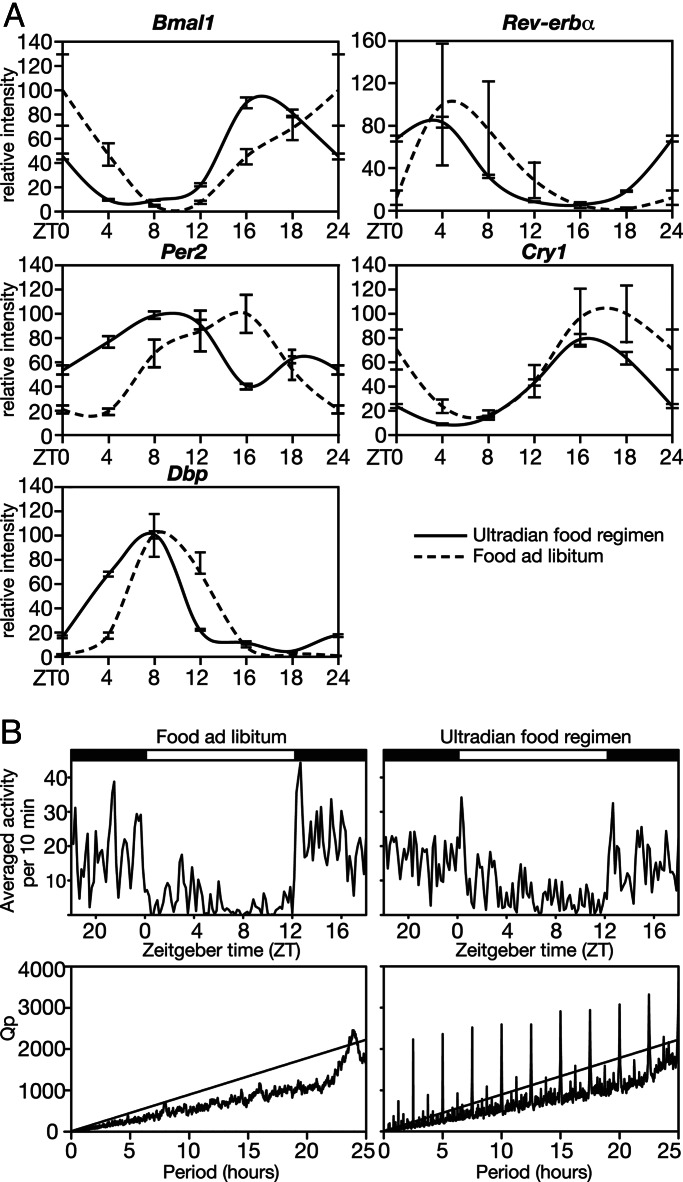
In most mammals, daily rhythms in physiology are driven by a circadian timing system composed of a master pacemaker in the suprachiasmatic nucleus (SCN) and peripheral oscillators in most body cells. The SCN clock, which is phase-entrained by light-dark cycles, is thought to synchronize subsidiary oscillators in peripheral tissues, mainly by driving cyclic feeding behavior. Here, we examined the expression of circadian clock genes in the SCN and the liver of the common vole Microtus arvalis, a rodent with ultradian activity and feeding rhythms. In these animals, clock-gene mRNAs accumulate with high circadian amplitudes in the SCN but are present at nearly constant levels in the liver. Interestingly, high-amplitude circadian liver gene expression can be elicited by subjecting voles to a circadian feeding regimen. Moreover, voles with access to a running wheel display a composite pattern of circadian and ultradian behavior, which correlates with low-amplitude circadian gene expression in the liver. Our data indicate that, in M. arvalis, the amplitude of circadian liver gene expression depends on the contribution of circadian and ultradian components in activity and feeding rhythms.


Conflict of interest statement

Conflict of interest statement: No conflicts declared.

Figures

Fig. 1.
Fig. 1.
Ultradian activity in the common vole. (A) Maximal ultradian Fourier powers of voles housed either without or with a running wheel (n = 6 per group). Black circles indicate average power per group, error bars are standard error of the mean. Gray panels indicate 2nd and 3rd quartiles. The asterisk indicates significant difference (Mann–Whitney U test, P < 0.05). (B) Five-day averaged activity patterns of a vole housed without (Upper) and with (Lower) a running wheel. Environmental light conditions are shown at the tops of the panels. Average ± SEM (and intraindividual variation); 5.36 ± 2.36 (and 0.81) and 1.33 ± 0.61 (and 0.30) for voles housed without and with a running wheel, respectively, Mann–Whitney U test, P < 0.05). (C) Relative activity during the night (ZT12–ZT24) and during the day (ZT00–ZT12) in voles housed without or with running wheels. Mean values ± standard errors are shown (n = 6). The Student t test was used to compare activity levels during the day and during the night. The p factor is indicated above the histograms. (D) Double-plotted actograms of vole behavior, showing simultaneous records of wheel-running behavior, food-hopper swings, and overall activity (PIR) for a 14-day time span. The running wheel was blocked from midday 3 to midday 8 (gray area). Environmental light conditions are shown at the top.
Fig. 2.
Fig. 2.
Circadian gene expression in the SCN of voles. (A) In situ hybridization of coronal brain sections to cRNA antisense probes for various clock and clock-controlled genes. Only the ventral parts of the hypothalamus region containing the SCN are shown. The voles used for these experiments had access to unlimited food and a running wheel. (B) Temporal accumulation of Per1 mRNA and Per2 mRNAs in the SCN of voles subjected to different housing and feeding conditions. Restricted feeding (food provided between ZT12 and ZT04) lasted for 8 and 10 days, before the voles were killed for transcript analysis.
Fig. 3.
Fig. 3.
Circadian gene expression in vole liver. (A) Temporal accumulation of transcripts encoded by clock and clock-controlled genes in the livers of voles subjected to different housing and feeding conditions (indicated above the blots). Restricted feeding lasted for 8 and 10 days for voles housed in cages with or without running wheels, respectively. Per1 mRNA in 50 μg of whole-cell liver RNA was detected by ribonuclease protection assays. All other transcripts were revealed by Northern blot hybridization. Polyadenylated RNA (2 μg) was used in the Northern blot with Per2 DNA probes, and 10 μg of whole-cell RNA was used in all other Northern blot experiments. (B) Temporal accumulation of Rev-erbα (Revα) and Bmal1 mRNAs in the livers of voles (housed without running wheels) that were first food-entrained for 10 days and then shifted to unlimited food availability. (Left) Northern blot analysis was performed as described above for A. (Right) The autoradiographs were scanned and the signals quantified. The maximal signals were set as 1 for both Rev-erbα (Revα) and Bmal1 mRNAs. Note that both mRNAs still show circadian accumulation, albeit with a reduced amplitude when compared with that shown in A for food-entrained animals.
Fig. 4.
Fig. 4.
Temporal accumulation of Rev-erbα mRNA and Bmal1 mRNA in vole kidney. Kidney RNAs of voles fed ad libitum (ZT00 and ZT24) (Left) or exclusively between ZT12 and ZT04 were analyzed by Northern blot hybridization as described in Fig. 3 (Upper), and the signals obtained by autoradiography were quantified as described for Fig. 3B (Lower). The voles were housed without running wheels.
Fig. 5.
Fig. 5.
Impact of ultradian feeding on circadian liver gene expression and behavior in mice. (A) Mice, kept in cages without a running wheel and exposed to a 12-h-light/12-h-dark regimen, were fed during 11 days with meals (0.38 ± 0.042 g of ground chow per meal) delivered every 150 min by a computer-driven feeding machine. On the average, these animals received and absorbed 3.09 g of food per day. On the 11th day, the temporal accumulation of Bmal1 mRNA, Rev-erbα mRNA, Per2 mRNA, Cry1 mRNA, and Dbp mRNA in the liver was recorded by TaqMan real-time RT-PCR (n = 2 per time interval; error bars represent standard deviation). Control animals (n = 3) were housed under identical conditions but had unlimited access to food. These mice consumed 4.2 g of food per day. Note that ultradian feeding and/or calorie restriction advanced the phase of circadian liver gene expression by approximately 4 hours but had little influence on the amplitude. (B) Behavior of mice with ultradian and normal feeding patterns. (Upper) Spontaneous locomotor activity, as measured by infrared-beam breaks, was recorded during 10 days for animals fed at 150-min intervals (n = 11) and animals fed ad libitum (n = 7). The activities of all animals (of the respective groups) monitored during 10 consecutive days were compiled in diagrams showing the average activity of 10-min bins during a day. (Lower) Periodograms; χ2 periodograms (23) of the activity as shown in Upper. Rhythmicity indices Qp reveal significant 24-h patterns in animals receiving food ad libitum. Animals fed at 150-min intervals show sharp and highly significant ultradian periodicity at 150 min and multiples thereof.

Comment in

  • Circadian organization in the real world.
    Menaker M. Menaker M. Proc Natl Acad Sci U S A. 2006 Feb 28;103(9):3015-6. doi: 10.1073/pnas.0600360103. Epub 2006 Feb 21. Proc Natl Acad Sci U S A. 2006. PMID: 16492750 Free PMC article. No abstract available.

References

    1. Reppert S. M., Weaver D. R. Nature. 2002;418:935–941. - PubMed
    1. Liu C., Weaver D. R., Strogatz S. H., Reppert S. M. Cell. 1997;91:855–860. - PubMed
    1. Nagoshi E., Saini C., Bauer C., Laroche T., Naef F., Schibler U. Cell. 2004;119:693–705. - PubMed
    1. Welsh D. K., Yoo S. H., Liu A. C., Takahashi J. S., Kay S. A. Curr. Biol. 2004;14:2289–2295. - PMC - PubMed
    1. Yoo S. H., Yamazaki S., Lowrey P. L., Shimomura K., Ko C. H., Buhr E. D., Siepka S. M., Hong H. K., Oh W. J., Yoo O. J., Menaker M., Takahashi J. S. Proc. Natl. Acad. Sci. USA. 2004;101:5339–5346. - PMC - PubMed

Publication types

Associated data

LinkOut - more resources