Review
. 2006 Mar;188(5):1667-79.
doi: 10.1128/JB.188.5.1667-1679.2006.

Use of thymine limitation and thymine starvation to study bacterial physiology and cytology

Affiliations
Review

Use of thymine limitation and thymine starvation to study bacterial physiology and cytology

Arieh Zaritsky et al. J Bacteriol. 2006 Mar.
No abstract available


Figures

FIG. 1.
FIG. 1.
The wild-type (top) and salvage (bottom) pathways for thymidylate synthesis. (Adapted from references , , and .) Wild-type species of bacteria are unable to pump thymine into the cells (92) and to incorporate it into DNA. Thy auxotrophs lack thymidylate synthetase activity and, hence, cannot produce thymidine nucleotides by the natural route (top panel), while they gained the ability to incorporate thymine into DNA by condensing it with deoxyribose-1-phosphate (dRib-1-P) to thymidine, a reaction catalyzed by thymidine phosphorylase (bottom). The negligible pool of dRib-1-P in thy+ cells that limits this condensation increases substantially in size in thyA mutants, since they accumulate U-dRib-P, which is degraded into dRib-1-P through U-dRib. Addition of a nucleoside such as 2′-deoxyguanosine (dG) similarly results in a wild-type pool size of dRib-1-P (6). Blocking further catabolism of the latter by deoB or deoC mutation results in a still higher pool size and, hence, lower thymine concentrations (2 rather than 20 μg ml1) are sufficient to support growth of thyA strains carrying at least one of these mutations; such double or triple mutants are “thymine-low-requirers.” At least two additional mutations affect the regulation of thymidine phosphorylase to convert the cell to a “super-low requirer” (can grow on concentrations as low as 0.2 μg ml1). Mutants lacking thymidine phosphorylase cannot utilize thymine, and those lacking thymidine kinase fail to incorporate thymidine as well.
FIG. 2.
FIG. 2.
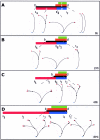
Bacterial cell cycle, based on the Cooper-Helmstetter model (44), with additional data obtained in various laboratories, as follows. A cell initiates chromosome replication at oriC when it reaches a constant mass/oriC (Mi), terminates replication at terC after C min (red bar), and divides D min later (blue bar). The time spans to division from birth (τ) and from appearance of constriction (T [124]) and FtsZ ring (Z [26]) are depicted as black, green, and orange bars, respectively. The times of cell birth and division, and of initiation and termination of its chromosome replication in the current cycle, are labeled b, d, i1, and t1, respectively. The examples displayed are each of a newborn cell growing steadily with the following specific series of cell cycle parameters (τ, C, D, T, and Z, respectively): 60, 40, 20, 16, and 22 in A; 40, 40, 20, 16, and 22 in B; 25, 40, 20, 16, and 22 in C; and 40, 90, 35, 30, and 38 in D. In practice, A to C are obtained by nutritional changes, and D is obtained by thymine limitation. In conditions when cell cycles overlap, that is τ < N(C + D), and N is a positive, non-zero integer, initiation or termination occurs at the -Nth cycle and the following events are labeled successively in and tn. Under such circumstances, cell mass at initiation is a 2(N1) multiple of Mi (shown at the bottom right of each panel). Schematic chromosome structures at different cell cycle stages are shown, with relative positions of oriC (red dot), terC (blue dot), and replicating forks (black or gray dot, depending on its 3-dimensional position on the circle, viewed at an angle of 72.5o [perspective of 0.3]). Given are the structures at cell birth b (equivalent to one of two at division d [shown in panel A only]), during replication or at termination (in panels A and B), as well as between t1 and i3 or i4 and between i3/i4 and d (in panels C and D, respectively).
FIG. 3.
FIG. 3.
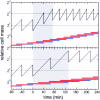
Relative mass of a newborn cell during its cycle and transitions (at time zero; all in minutes) from growth conditions of τ = 40, C = 40, and D = 20 to growth with τ = 25, C = 40, and D = 20 (shift-up; top panel) and to growth with the same rate (τ = 40) and D = 20 but C = 90 (step-down; bottom panel). Colors of bars conform to those in Fig. 2. Gray areas indicate the transition periods. Horizontal lines indicate 2(N1) multiples of initiation mass Mi (see the legend to Fig. 2). (Adapted from the schematic online simulation of Norbert Vischer, which is freely available at http://simon.bio.uva.nl.)
FIG. 4.
FIG. 4.
Changes of relative average cell length (A) and diameter (B) during nutritional shift-up (filled circles) and thymine step-down (open circles) of cultures of E. coli B/r strain H266 (125) and K-12 strain CR34 (thr-1 leuB6 thi thyA drm [141-143]), respectively. Shift-up was performed from alanine-proline to glucose-Casa minimal medium (τ1 = 72 min; τ2 = 24 min). Step-down in glucose minimal medium (τ of ca. 53 min) from 10 μg thymine ml1 and 100 μg ml1 dG (yielding a C1 of ∼50 min) to 2.5 μg ml1 thymine and no dG (by washing off thymine and dG using filtration and resuspending the cells in the same medium but a low [thymine] yielding C2 of about 90 min). Culture densities were kept below A450 of 0.5 by successive four- to sixfold dilutions with prewarmed medium. (C and D) Cells were photographed at 180 min of the shift-up and step-down transitions of E. coli CR34, respectively. Bars, 2 μm. (Inset) Average cell diameter in various E. coli strains as a function of the nucleoid complexity (C/τ; filled circles) or size (DNA in genome equivalent units per terC; empty circles).
FIG. 5.
FIG. 5.
Time before cell separation when constriction is visible (T min) as a function of cell diameter (2R) and doubling time (τ) in E. coli B/r strains A (filled circles) and K (empty circles) (124), in E. coli K12 strain CR34 (filled triangles) and its repA derivative (empty triangles) (141), and in E. coli K-12 strain LMC 500 (crosses) (1). Values of T were calculated from the percent of constricted cells visible in either a transmission electron microscope or a light microscope (as in reference or , respectively) of steady-state growing cultures. Regression line and function was calculated with the lower 20 data points. S.D., standard deviation.
FIG. 6.
FIG. 6.
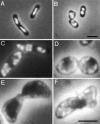
Cell shapes and nucleoid arrangements under thymine limitation. Steady-state, exponentially growing E. coli K-12 cultures of strain CR34 (Fig. 4 and 5) in glucose minimal medium (τ = 60 min) supplemented with (A) 10 μg ml1 thymine and 20 μg ml1 dG or (B) 0.4 μg ml1 thymine without dG. (C to F) The same cells (selected from Fig. 3 in reference 145) growing exponentially in the same minimal medium, but supplemented with 1% Casamino Acids and 5 μg thymine ml1 without dG (τ of ∼30 min) (C), after 60 min of amdinocillin (1 μg ml1) treatment (D), and 60 min after washing off the drug and adding 15 μg ml1 thymine and 100 μg ml1 dG (E and F). Nucleoids labeled with 10 μM DAPI (4′,6′-diamidino-2-phenylindone dihydrochloridehydrate) are distributed along cell surface in “parachute”-like structures. Splitting tips by secondary constrictions are seen in panels B and F. Bars, 2 μm (A and B) and 5 μm (C to F).
FIG. 7.
FIG. 7.
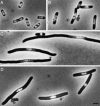
Changes in nucleoid structure during thymine starvation. E. coli K-12 strain CR34 thyA was grown in glucose minimal medium supplemented with Casein hydrolysate (1%), thymine, and deoxyguanosine (dG) (20 μg ml1 each) for more than 10 generations to achieve a steady state of growth. At A450 = 0.4, the culture was filtered, washed, and resuspended in fresh, prewarmed medium without thymine and dG. Cells were stained with DAPI (10 μM), fixed with 0.1% OsO4, and concentrated by centrifugation. Cells were immobilized on a thin agar layer and observed under an Olympus BX60 microscope as described previously (115). Samples are shown from control, before starvation (A), 60 and 180 min afterwards (B and C, respectively), and 120 min after chloramphenicol treatment following 120 min of starvation (D). Bar, 2 μm.

Similar articles

Cited by

References

    1. Aarsman, M. E. G., A. Piette, C. Fraipont, T. M. F. Vinkelvleugel, M. Nguyen-Distèche, M., and T. den Blaauwen. 2005. Maturation of the Escherichia coli divisome occurs in two steps. Mol. Microbiol. 55:1631-1645. - PubMed
    1. Ahmad, S. I., S. H. Kirk, and A. Eisenstark. 1998. Thymine metabolism and thymineless death in prokaryotes and eukaryotes. Annu. Rev. Microbiol. 52:591-625. - PubMed
    1. Baldwin, W. W., M. J.-T. Sheu, P. W. Bankston, and C. L. Woldringh. 1988. Changes in Buoyant density and cell size of Escherichia coli in response to osmotic shocks. J. Bacteriol. 170:452-455. - PMC - PubMed
    1. Barner, H. D., and S. S. Cohen. 1956. Synchronization of division of a thymineless mutant of Escherichia coli. J. Bacteriol. 72:115-123. - PMC - PubMed
    1. Bazill, G. W. 1967. Lethal unbalanced growth in bacteria. Nature 216:346-349. - PubMed

Publication types

LinkOut - more resources