

Post-hypoxic hypoperfusion is associated with suppression of cerebral metabolism and increased tissue oxygenation in near-term fetal sheep
- PMID: 16484307
- PMCID: PMC1779646
- DOI: 10.1113/jphysiol.2005.100768
Post-hypoxic hypoperfusion is associated with suppression of cerebral metabolism and increased tissue oxygenation in near-term fetal sheep
Abstract
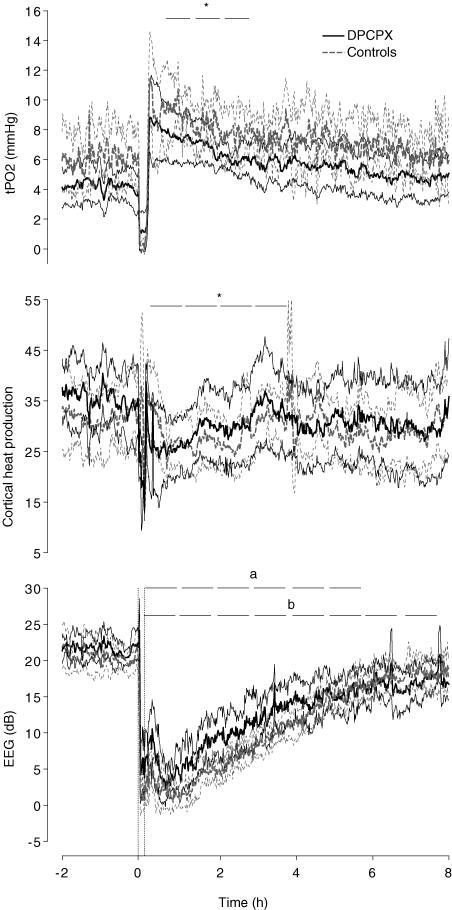
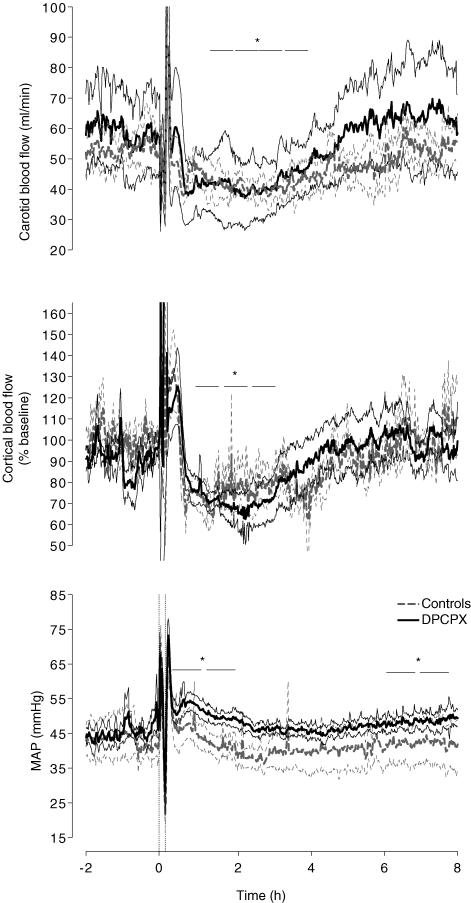
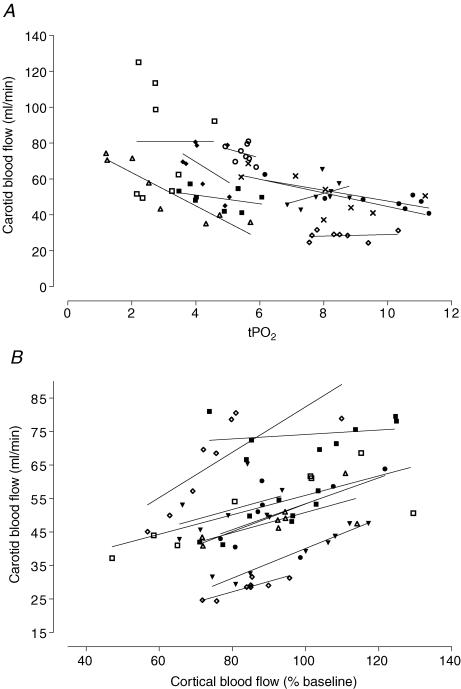
Secondary cerebral hypoperfusion is common following perinatal hypoxia-ischaemia. However, it remains unclear whether this represents a true failure to provide sufficient oxygen and nutrients to tissues, or whether it is simply a consequence of reduced cerebral metabolic demand. We therefore examined the hypothesis that cerebral oxygenation would be reduced during hypoperfusion after severe asphyxia, and further, that the greater neural injury associated with blockade of the adenosine A(1) receptor during the insult would be associated with greater hypoperfusion and deoxygenation. Sixteen near-term fetal sheep received either vehicle or 8-cyclopentyl-1,3-dipropylxanthine (DPCPX) for 1 h, followed by 10 min of severe asphyxia induced by complete occlusion of the umbilical cord. Infusions were discontinued at the end of the occlusion and data were analysed for the following 8 h. A transient, secondary fall in carotid artery blood flow and laser Doppler flow was seen from approximately 1-4 h after occlusion (P < 0.001), with no significant differences between vehicle and DPCPX. Changes in laser Doppler blood flow were highly correlated with carotid blood flow (r(2)= 0.81, P < 0.001). Cortical metabolism was suppressed, reaching a nadir 1 h after occlusion and then resolving. Cortical tissue P(O(2)) was significantly increased at 1, 2 and 3 h after occlusion compared to baseline, and inversely correlated with carotid blood flow (r(2)= 0.69, P < 0.001). In conclusion, contrary to our initial hypothesis, delayed posthypoxic hypoperfusion was associated with suppression of cerebral metabolism and increased tissue P(O(2)), and was not significantly affected by preceding adenosine A1 blockade. These data suggest that posthypoxic hypoperfusion is actively mediated and reflects suppressed cerebral metabolism.
Figures
References
-
- Conger JD, Weil JV. Abnormal vascular function following ischemia-reperfusion injury. J Invest Med. 1995;43:431–442. - PubMed
Publication types
MeSH terms
Substances
Grants and funding
LinkOut - more resources
Full Text Sources