. 2006 Feb 28;103(9):3262-7.
doi: 10.1073/pnas.0507783103. Epub 2006 Feb 16.

Accumulation of unstable promoter-associated transcripts upon loss of the nuclear exosome subunit Rrp6p in Saccharomyces cerevisiae

Affiliations

Accumulation of unstable promoter-associated transcripts upon loss of the nuclear exosome subunit Rrp6p in Saccharomyces cerevisiae

Carrie Anne Davis et al. Proc Natl Acad Sci U S A. .

Abstract

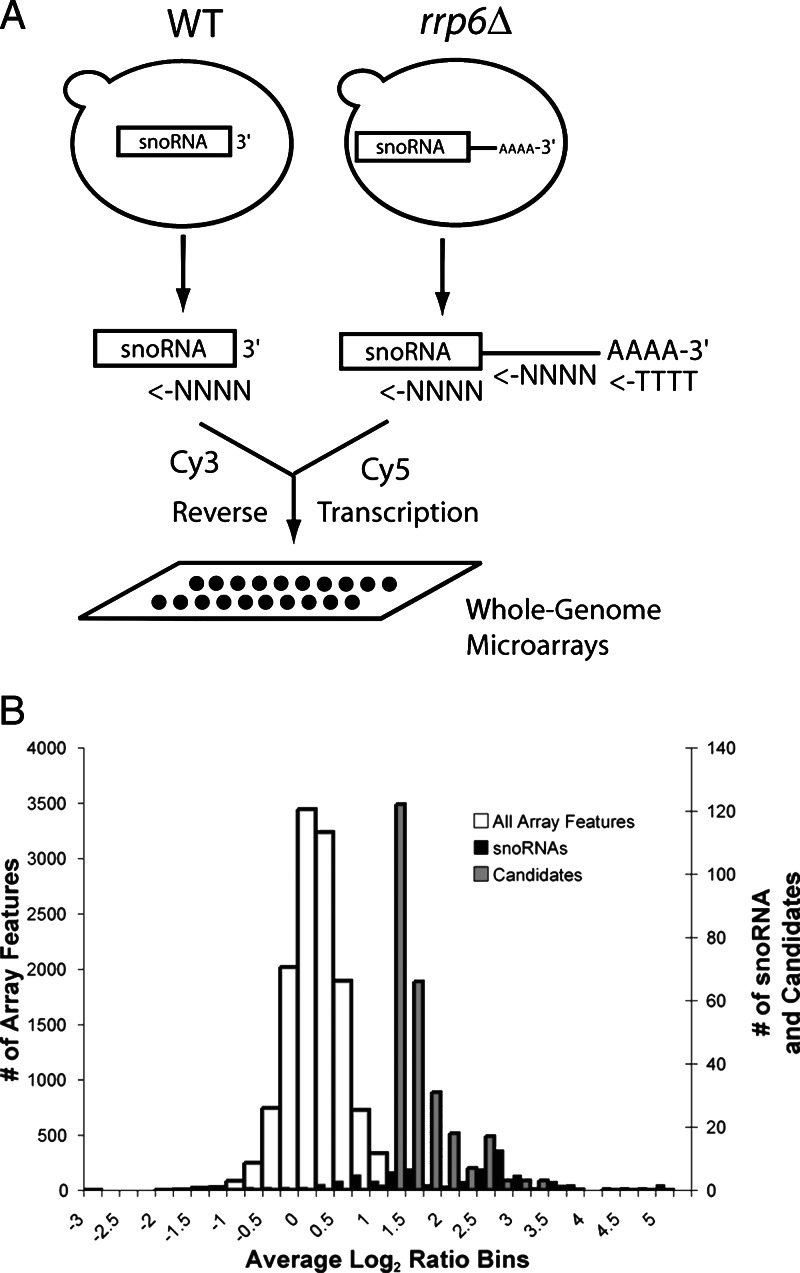
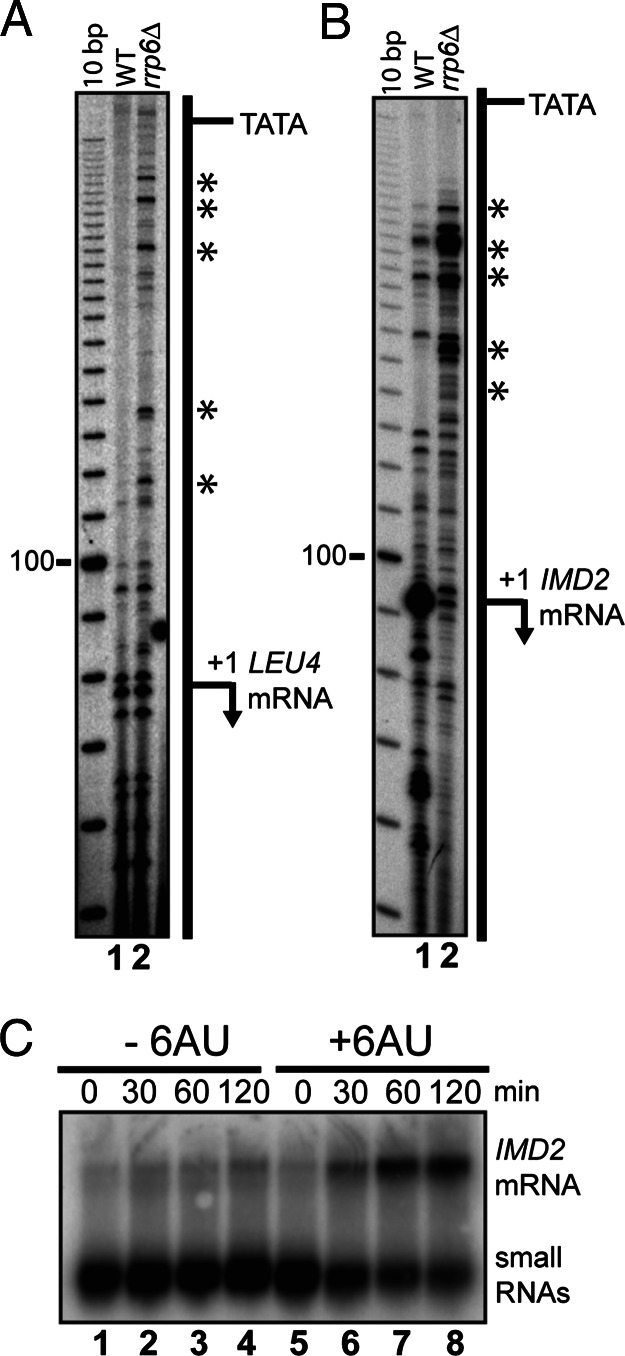
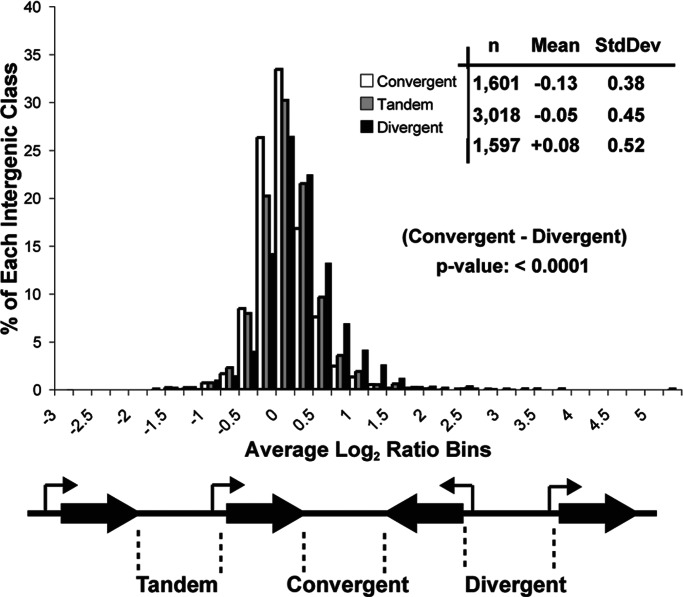
Mutations in RRP6 result in the accumulation of aberrant polyadenylated transcripts from small nucleolar RNA genes. We exploited this observation to search for novel noncoding RNA genes in the yeast genome. When RNA from rrp6Delta yeast is compared with wild-type on whole-genome microarrays, numerous intergenic loci exhibit an increased mutant/wild type signal ratio. Among these loci, we found one encoding a new C/D box small nucleolar RNA, as well as a surprising number that gave rise to heterogeneous Trf4p-polyadenylated RNAs with lengths of approximately 250-500 nt. This class of RNAs is not easily detected in wild-type cells and appears associated with promoters. Fine mapping of several such transcripts shows they originate near known promoter elements but do not usually extend far enough to act as mRNAs, and may regulate the transcription of downstream mRNAs. Rather than being uninformative transcriptional "noise," we hypothesize that these transcripts reflect important features of RNA polymerase activity at the promoter. This activity is normally undetectable in wild-type cells because the transcripts are somehow distinguished from true mRNAs and are degraded in an Rrp6p-dependent fashion in the nucleus.


Conflict of interest statement

Conflict of interest statement: No conflicts declared.

Figures

Fig. 1.
Fig. 1.
Genomic loci affected by loss of RRP6. (A) Scheme used to identify RNAs enriched or hyperadenylated in the rrp6Δ mutant. (B) Histogram of microarray results. Shown is the distribution of the average log2 ratio signal for the following: all array features, white bars (mean = 0.03, SD = 0.5); snoRNA-containing features, black bars; unannotated intergenic features above 1.04 (>2 SD), gray bars. Note that the axis for all of the array features (primary y axis) differs from that for the snoRNA and intergenic features (secondary y axis).
Fig. 2.
Fig. 2.
C/D box snoRNA snR87 guides methylation of 18S rRNA A436. (A) Northern blot of transcripts in iYKL006C-a. Total RNA from wild-type (lane1) and rrp6Δ (lane 2) strains was fractioned on a 6% acrylamide gel and transferred. The membrane was probed with a dsDNA probe spanning the region. Mature snR87 (rectangle) and precursors or aberrant products are indicated at the right. (B) Test for methylation of 18S rRNA near nucleotide A436. Total RNA from wild type (lanes 1–3) and snr87Δ (lanes 4–6) were reverse-transcribed under limiting dNTP levels and run on a 6% sequencing gel. The stops generated corresponding to known sites of methylation A420 and A436 are indicated at the right. (C) Predicted alignment of snR87 with 18S rRNA near A436. The C/D box signature motifs are indicated.
Fig. 3.
Fig. 3.
RNAs accumulate in the absence of RRP6 or TRF4. Northern blots detect transcripts from genomic loci. (A) rrp6Δ. Five micrograms of total RNA from wild-type (lane 1) and rrp6Δ (lane 2) strains, 300 ng of poly(A)+ RNA from rrp6Δ strain (lane 3), and 5 μg of poly(A)− RNA from rrp6Δ strain (lane 4) were loaded onto a 1% agarose-formaldehyde gel and probed with the indicated regions. (B) trf4Δ. Five micrograms of total RNA from wild-type (lane 1) and trf4Δ (lane 2) strains, 300 ng of poly(A)+ RNA from trf4Δ strain (lane 3), and 5 μg of poly(A)− RNA from trf4Δ strain (lane 4) was used. Annotations for the region are indicated on the left, and the probed region is indicated by the black bar. Dubious ORFs are shaded in gray. The name of the candidate region and size of the heterogeneous RNAs are indicated on the right.
Fig. 4.
Fig. 4.
SRG1 is a promoter associated RNA whose decay requires Rrp6p. (A) Northern blot to detect the levels of poly(A)+ and poly(A)− SRG1 RNA (Upper): 3 μg of total RNA from wild type, trf4Δ, and rrp6Δ (lanes 1, 4, and 7), 100 ng of poly(A)+ RNA from wild type, trf4Δ, and rrp6Δ (lanes 2, 5, and 8), and 3 μg of poly(A)− RNA from wild type, trf4Δ, and rrp6Δ (lanes 3, 6, and 9). The membrane was probed with an SRG1-specific oligo. (Lower) A duplicate membrane probed with an oligo complementary to snR128. (B) Northern blot analysis of SER3 in different yeast mutants. Three micrograms of total RNA from wild-type (lane 1), trf4Δ (lane 2), rrp6Δ (lane 3), heat-shifted spt5-194 (lane 4), heat-shifted spt5-194, rrp6Δ (lane 5), and snf2Δ (lane 6) yeast were fractioned on a 1% agarose formaldehyde gel. The membrane was probed with an SRG1+SER3 oligo complementary to a region contained in both SRG1 RNA and SER3 mRNA.
Fig. 5.
Fig. 5.
RNAs map to promoters of IMD2 and LEU4. Primer extensions to map the 5’ end of RNA associated with the promoters of LEU4 (A) and IMD2 (B) from wild-type (lane 1) and rrp6Δ (lane 2) strains. The positions of upstream starts uncovered in the absence of RRP6 are indicated by an asterisk. The positions of TATA boxes tested in refs. and are indicated. Primer sequences are described in Supporting Methods. (C) Northern blots on 5 μg of total RNA from rrp6Δ strain grown in SCD-Ura media at times 0, 30, 60, and 120 min after treatment with 6-azauracil (lanes 5–8) or untreated (lanes 1–4).
Fig. 6.
Fig. 6.
Promoter-containing intergenic regions accumulate the most RNA in the absence of RRP6. Shown is a histogram representing the distribution of the average signal log2 ratio for all intergenic features as indicated below. The results of a two-tailed unpaired t test comparing convergent–divergent distributions are shown in the Inset.

References

    1. Velculescu V. E., Zhang L., Zhou W., Vogelstein J., Basrai M. A., Bassett D. E., Jr., Hieter P., Vogelstein B., Kinzler K. W. Cell. 1997;88:243–251. - PubMed
    1. Kapranov P., Cawley S. E., Drenkow J., Bekiranov S., Strausberg R. L., Fodor S. P., Gingeras T. R. Science. 2002;296:916–919. - PubMed
    1. Schadt E. E., Edwards S. W., GuhaThakurta D., Holder D., Ying L., Svetnik V., Leonardson A., Hart K. W., Russell A., Li G., et al. Genome Biol. 2004;5:R73. - PMC - PubMed
    1. Cheng J., Kapranov P., Drenkow J., Dike S., Brubaker S., Patel S., Long J., Stern D., Tammana H., Helt G., et al. Science. 2005;308:1149–1154. - PubMed
    1. Li L., Wang X., Xia M., Stolc V., Su N., Peng Z., Li S., Wang J., Wang X., Deng X. W. Genome Biol. 2005;6:R52. - PMC - PubMed

Publication types

MeSH terms

Associated data