Comparative Study
. 2006 Feb;27(2):409-17.

Comparison of microvascular permeability measurements, K(trans), determined with conventional steady-state T1-weighted and first-pass T2*-weighted MR imaging methods in gliomas and meningiomas

Affiliations
Comparative Study

Comparison of microvascular permeability measurements, K(trans), determined with conventional steady-state T1-weighted and first-pass T2*-weighted MR imaging methods in gliomas and meningiomas

S Cha et al. AJNR Am J Neuroradiol. 2006 Feb.

Abstract

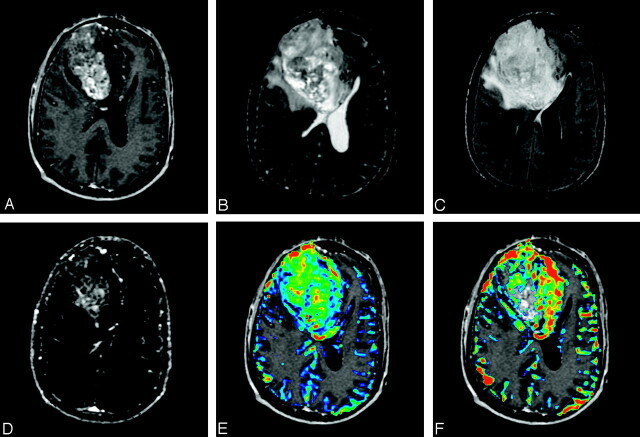
Background and purpose: The widely accepted MR method for quantitating brain tumor microvascular permeability, K(trans), is the steady-state T1-weighted gradient-echo method (ssT1). Recently the first-pass T2*-weighted (fpT2*) method has been used to derive both relative cerebral blood volume (rCBV) and K(trans). We hypothesized that K(trans) derived from the ssT1 and the fpT2* methods will correlate differently in gliomas and meningiomas because of the unique differences in morphologic and functional status of each tumor vascular network.

Methods: Before surgery, 27 patients with newly diagnosed gliomas (WHO grade I-IV; n = 20) or meningiomas (n = 7) underwent conventional anatomic MR imaging and 12 dynamic ssT1 acquisitions followed by 60 dynamic fpT2* images before and after gadopentate dimeglumine administration. The 3 hemodynamic variables-fpT2* rCBV, fpT2* K(trans), and ssT1 K(trans)-were calculated in anatomically identical locations and correlated with glioma grade. The fpT2* K(trans) values were compared with ssT1 K(trans) for gliomas and meningiomas.

Results: All 3 hemodynamic variables displayed distinct distributions among grades 2, 3, and 4 gliomas by using the Kruskal-Wallis test. Only K(trans) values, and not rCBV, could differentiate between grade 4 and lower-grade gliomas by using the Wilcoxon rank sum test. The fpT2* K(trans) was highly predictive of ssT1 K(trans) for gliomas, with an estimated regression coefficient of 0.49 (P < .001). For meningiomas, however, fpT2* K(trans) values correlated poorly with ssT1 K(trans) values (r = 0.26; P = .74).

Conclusion: Compared with rCBV, K(trans) values derived from either ssT1 or fpT2* were more predictive of glioma grade. The fpT2* K(trans) was highly correlated with ssT1 K(trans) in gliomas but not in meningiomas.


Figures

Fig 1.
Fig 1.
Right frontal anaplastic oligoastrocytoma (WHO grade III) in a 43-year-old man. A dynamic series of ssT1 SPGR images through one anatomic location before, during, and after the administration of intravenous Gd-DTPA demonstrate earlier enhancement of normal vessels followed by delayed and persistent enhancement of the right frontal high-grade glioma.
Fig 2.
Fig 2.
Left cavernous sinus hemangiopericytoma in a 30-year-old woman. A dynamic series of ssT1 SPGR images through multiple anatomic locations before (top row), during (middle 2 rows), and after (bottom row) the administration of intravenous Gd-DTPA demonstrate simultaneous contrast agent arrival within the normal vessels (second row, horizontal arrows) and within this highly vascular extra-axial brain tumor (slanted arrow).
Fig 3.
Fig 3.
Left thalamic/posterior frontal GBM (WHO grade IV) in a 63-year-old man. Upper panel, Left, Transaxial contrast-enhanced SPGR image demonstrates an enhancing left dorsolateral thalamic and posterior frontal lobe tumor (arrow). Middle and Right, Transaxial T2-weighted image (middle) and FLAIR (right) show moderate degree of surrounding edema (arrowheads). Lower panel, Left, Transaxial ssT1 Ktrans map demonstrates a rim of increased permeability (arrow). Middle, Transaxial fpT2* Ktrans color map overlayed onto SPGR image also shows a rim of increased permeability. Right, Transaxial fpT2* rCBV color map overlayed onto SPGR image demonstrates similar rim shape of increased blood volume but more focused on the medial aspect of the tumor (arrow).
Fig 4.
Fig 4.
Right frontal anaplastic oligoastrocytoma (WHO grade III) in a 43-year-old man. Upper panel, Left, Transaxial contrast-enhanced SPGR image demonstrates a large heterogeneously right frontal lobe tumor. Middle and Right, Transaxial T2-weighted image (middle) and FLAIR (right) show moderate degree of surrounding edema. Lower panel, Left, Transaxial ssT1 Ktrans map demonstrates a large central area of increased permeability. Middle, Transaxial fpT2* Ktrans color map overlayed onto SPGR image also shows global increase in permeability throughout the tumor. Right, Transaxial fpT2* rCBV color map overlayed onto SPGR image demonstrates increased blood volume mostly involving the medial aspect of the tumor.
Fig 5.
Fig 5.
Box plots of fpT2* rCBV maximum, ssT1- and fpT2*-derived Ktrans values (in minutes−1) for grades I, II, III, and IV gliomas. Box plots of fpT2* rCBV maximum, ssT1- and fpT2*-derived Ktrans values (in minutes−1) for grades I, II, III, and IV gliomas. The red box extends from the first quartile to the third quartile of the data, with the white line marking the median. The black lines with end brackets represent the most extreme observations in the data that are not more than 1.5 times the height of the box beyond either quartile. All points outside this range are presented by a circle and are considered to be outliers. There was only one patient with grade I gliomas (pilocytic astrocytoma), and the value was presented as horizontal [I] bar in the plots.
Fig 6.
Fig 6.
Scatter plots and fitted regression line of ssT1-derived Ktrans on fpT2*-derived Ktrans. The Pearson correlation coefficient for gliomas is high and estimated to be 0.95 (95% CI [0.89, 0.98]); however, no linear correlation exists between fpT2* and ssT1 Ktrans values for meningiomas, with the Pearson correlation coefficient estimated to be 0.16 (95% CI [−0.68, 0.81]).

Comment in

References

    1. Provenzale JM, Wang GR, Brenner T, et al. Comparison of permeability in high-grade and low-grade brain tumors using dynamic susceptibility contrast MR imaging. AJR Am J Roentgenol 2002;178:711–16 - PubMed
    1. Stewart PA, Hayakawa K, Farrell CL, et al. Quantitative study of microvessel ultrastructure in human peritumoral brain tissue: evidence for a blood-brain barrier defect. J Neurosurg 1987;67:697–705 - PubMed
    1. Uematsu H, Maeda M, Sadato N, et al. Vascular permeability: quantitative measurement with double-echo dynamic MR imaging: theory and clinical application. Radiology 2000;214:912–17 - PubMed
    1. Yang S, Law M, Zagzag D, et al. Dynamic contrast-enhanced perfusion MR imaging measurements of endothelial permeability: differentiation between atypical and typical meningiomas. AJNR Am J Neuroradiol 2003;24:1554–59 - PMC - PubMed
    1. Law M, Yang S, Babb JS, et al. Comparison of cerebral blood volume and vascular permeability from dynamic susceptibility contrast-enhanced perfusion MR imaging with glioma grade. AJNR Am J Neuroradiol 2004;25:746–55 - PMC - PubMed

Publication types

MeSH terms