. 2006 Jul;35(1):55-64.
doi: 10.1165/rcmb.2005-0453OC. Epub 2006 Feb 16.

Do biophysical properties of the airway smooth muscle in culture predict airway hyperresponsiveness?

Affiliations

Do biophysical properties of the airway smooth muscle in culture predict airway hyperresponsiveness?

Steven S An et al. Am J Respir Cell Mol Biol. 2006 Jul.

Abstract

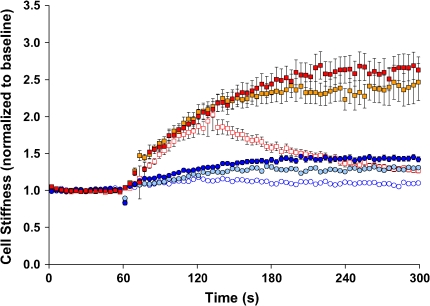
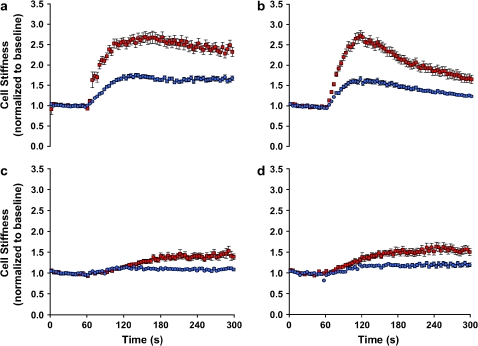
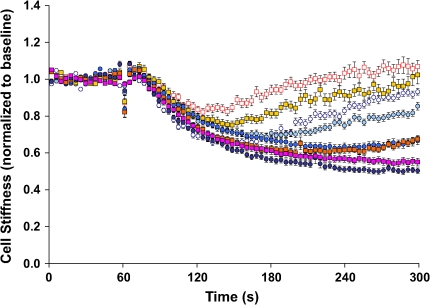
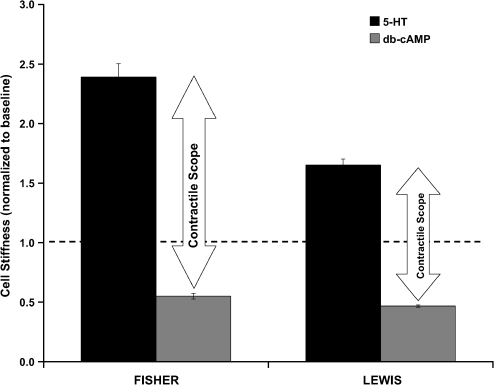
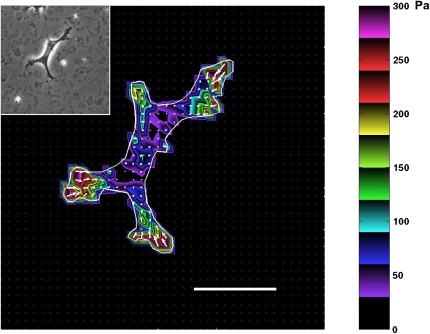
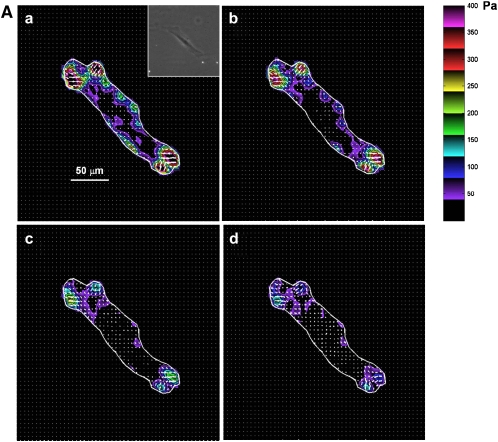
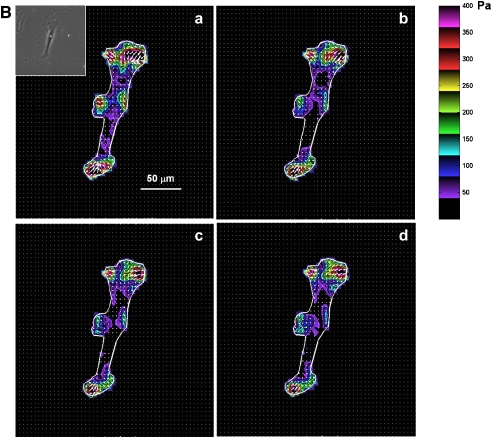
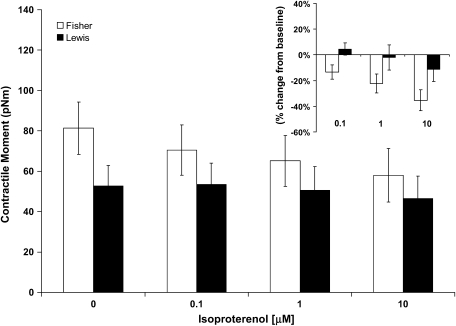
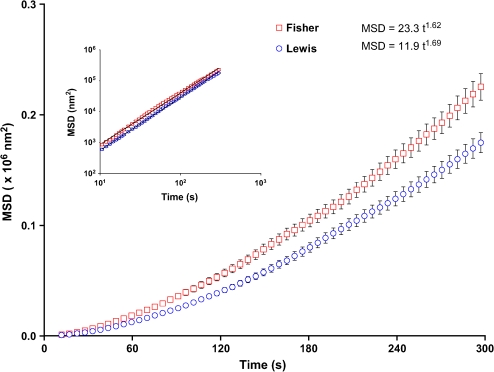
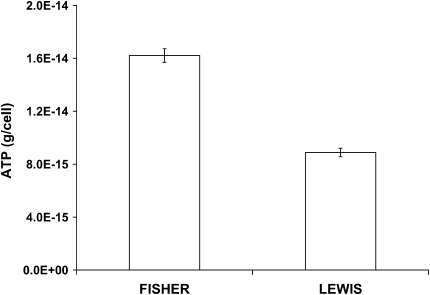
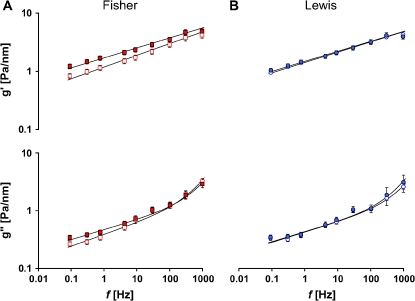
Airway hyperresponsiveness is a cardinal feature of asthma but remains largely unexplained. In asthma, the key end-effector of acute airway narrowing is the airway smooth muscle (ASM) cell. Here we report novel biophysical properties of the ASM cell isolated from the relatively hyporesponsive Lewis rat versus the relatively hyperresponsive Fisher rat. We focused upon the ability of the cytoskeleton (CSK) of the ASM cell to stiffen, to generate contractile forces, and to remodel. We used optical magnetic twisting cytometry to measure cell stiffness and traction microscopy to measure contractile forces. To measure remodeling dynamics, we quantified spontaneous nanoscale motions of a microbead tightly anchored to the CSK. In response to a panel of contractile and relaxing agonists, Fisher ASM cells showed greater stiffening, bigger contractile forces, and faster CSK remodeling; they also exhibited higher effective temperature of the CSK matrix. These physical differences measured at the level of the single cell in vitro were consistent with strain-related differences in airway responsiveness in vivo. As such, comprehensive biophysical characterizations of CSK dynamics at the level of the cell in culture may provide novel perspectives on the ASM and its contributions to the excessive airway narrowing in asthma.


Figures

<b>Figure 1.</b>
Figure 1.
Stiffness changes in response to 5-HT. ASM cells isolated from the relatively hyporesponsive Lewis rat (circles) and the relatively hyperresponsive Fisher rat (squares) were stimulated with increasing doses of 5-HT (0.1 μM, blue open circles, red open squares; 1 μM, teal closed circles, gold closed squares; 10 μM, blue closed circles, red closed squares). For each cell, stiffness was measured continuously for 300 s. Baseline stiffness was measured for the first 0–60 s, and a change in stiffness in response to 5-HT was measured up to the indicated time (60–300 s). At each dose of 5-HT, changes in cell stiffness were normalized to the baseline stiffness of each individual cell before stimulation. Data are recorded at intervals that were equally spaced in time (1.3 s) but, for clarity, are suppressed and presented at intervals of 3.9 s. Data are presented as mean ± SE (n = 279–348 cells).
<b>Figure 2.</b>
Figure 2.
Stiffness changes in response to a panel of contractile agonists. ASM cells isolated from the relatively hyporesponsive Lewis rat (blue closed circles) and the relatively hyperresponsive Fisher rat (red closed squares) were maximally stimulated with a panel of contractile agonists: (a) 5-HT (1 μM); (b) bradykinin (1 μM); (c) acetylcholine (1 μM); (D) carbachol (100 μM). For each agonist, changes in cell stiffness were normalized to the baseline stiffness of each individual cell before stimulation. For clarity, data are presented at intervals of 3.9 s. Data are presented as mean ± SE (n = 473–804 cells).
<b>Figure 3.</b>
Figure 3.
Stiffness changes in response to β-agonist. ASM cells isolated from the relatively hyporesponsive Lewis rat (circles) and the relatively hyperresponsive Fisher rat (squares) were stimulated with increasing doses of ISO (0.01 μM, blue open circles, red open squares; 0.1 μM, teal closed circles, gold closed squares; 1 μM, blue closed circles, red closed squares; 10 μM, purple closed circles, pink closed squares). At each dose of ISO, changes in cell stiffness were normalized to the baseline stiffness of each individual cell before stimulation. For clarity, data are presented at intervals of 3.9 s. Data are presented as mean ± SE (n = 197–346 cells).
<b>Figure 4.</b>
Figure 4.
Stiffness changes in response to db-cAMP. ASM cells were stimulated for 600 s with a cell-permeable cAMP analog, db-cAMP (1 mM), and changes in cell stiffness were normalized to the baseline stiffness of each individual cell before stimulation. Data from Figure 2 (1 μM, 5-HT) are plotted to show the extent of the stiffening response (contractile scope). Data are presented as mean ± SE (n = 672–722 cells).
<b>Figure 5.</b>
Figure 5.
Traction field map of the ASM cell on the elastic substrate. Rat ASM cells were sparsely plated on the polyacrylamide gel coated with collagen type I. The traction field was computed from the displacement field using constrained FTTC; the cell boundary is shown by the white line. Colors show the magnitude of the tractions in Pa (see color scale). Arrows show the direction and relative magnitude of the tractions. Young's modulus of the gel was 8,000 Pa. Inset: A phase-contrast image of the ASM cell. Scale bar, 50 μm.
<b>Figure 6.</b>
Figure 6.
Traction field changes in response to β-agonist. (A) Representative changes in traction field of Fisher ASM cell. (B) Representative changes in traction field of Lewis ASM cell. Both cells were stimulated sequentially with increasing doses of ISO: (a) 0 μM; (b) 0.1 μM; (c) 1 μM; (d) 10 μM. Colors show the magnitude of the tractions in Pa (see color scale). Arrows show the direction and relative magnitude of the tractions.
<b>Figure 7.</b>
Figure 7.
Contractile moment changes in response to β-agonist. ASM cells isolated from the relatively hyporesponsive Lewis rat and the relatively hyperresponsive Fisher rat were stimulated with increasing doses of ISO (0, 0.1, 1, and 10 μM). Contractile moment was calculated directly from the mean traction and expressed in units of pNm. No assumptions are made regarding the shape of the cell. Open bars represent Fisher ASM cells; closed bars represent Lewis ASM cells. Inset: For each cell, calculated contractile moment in response to ISO (0.1, 1, and 10 μM) is expressed as a percentage change from respective baseline. Data are presented as mean ± SE (n = 12 cells for each group).
<b>Figure 8.</b>
Figure 8.
The rate of cytoskeletal remodeling in the ASM cell. Spontaneous bead motions are quantified by their MSD as function of time (Eq. 1). For both cells (Lewis, blue open circles; Fisher, red open squares), the MSD increases with time according to a power law relationship. Inset: The coefficient D* and the exponent α of the bead motion were estimated from a least squares fit of a power law to the MSD data versus time. The MSDs were computed at intervals that were equally spaced in time (1.3 s). For clarity, we have suppressed many of these data and left only data at approximately logarithmically spaced intervals. Data are presented as mean ± SE (n = 1,006–1,015 cells).
<b>Figure 9.</b>
Figure 9.
The content of ATP in the ASM cell. For both cells (Fisher versus Lewis), cellular ATP content was measured by the bioluminescence assay (Promega). On each day of the experiments, sample RLU values were corrected for the background RLU (extractant/sample buffer) and converted to ATP mass from the ATP standard curve. ATP concentrations (nM) were normalized to the level of the total cell count. Data are presented as mean ± SE (n = 6 wells).
<b>Figure 10.</b>
Figure 10.
Stiffness g′ (top) and loss modulus g′ (bottom) versus frequency. The solid lines are the fit of experimental data to the structural damping equation with addition of a Newtonian viscous term as previously described (23). Fitting was performed by nonlinear regression analysis. Blue open circles represent baseline g′ and g″, and blue closed circles represent g′ and g″ of Lewis ASM cells in response to 1 μM 5-HT. Red open squares represent baseline g′ and g″, and red closed squares represent g′ and g″ of Fisher ASM cells in response to 1 μM 5-HT. Data are presented as mean ± SE (n = 43–62 cells).

References

    1. Woolcock AJ, Peat JK. Epidemiology of bronchial hyperresponsiveness. Clin Rev Allergy 1989;7:245–256. - PubMed
    1. Sterk PJ, Bel EH. Bronchial hyperresponsiveness: the need to distinguish between hypersensitivity and excessive airway narrowing. Eur Respir J 1989;2:267–274. - PubMed
    1. Black JL, Johnson PR. Airway smooth muscle in asthma. Respirology 1996;1:153–158. - PubMed
    1. King GG, Pare PD, Seow CY. The mechanics of exaggerated airway narrowing in asthma: the role of smooth muscle. Respir Physiol 1999;118:1–13. - PubMed
    1. Fredberg JJ. Bronchospasm and its biophysical basis in airway smooth muscle. Respir Res 2004;5:2. - PMC - PubMed

Publication types

Substances