

A cerebellar model for predictive motor control tested in a brain-based device
- PMID: 16488974
- PMCID: PMC1413924
- DOI: 10.1073/pnas.0511281103
A cerebellar model for predictive motor control tested in a brain-based device
Abstract
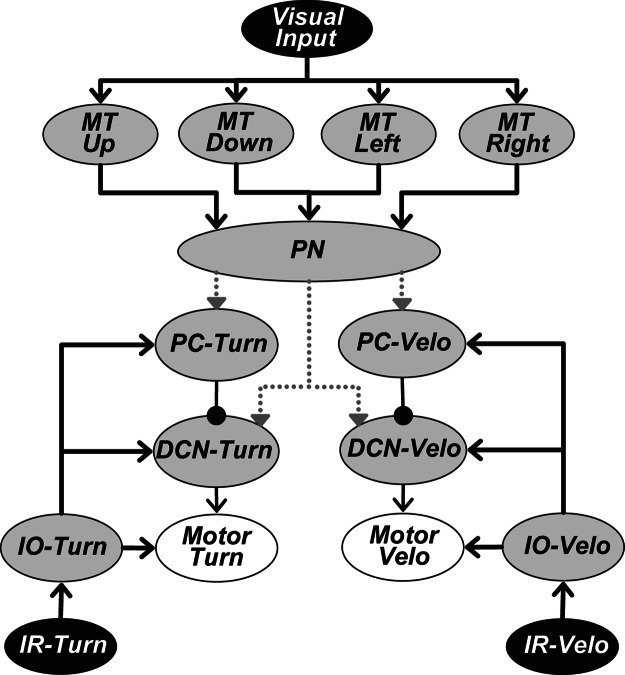
The cerebellum is known to be critical for accurate adaptive control and motor learning. We propose here a mechanism by which the cerebellum may replace reflex control with predictive control. This mechanism is embedded in a learning rule (the delayed eligibility trace rule) in which synapses onto a Purkinje cell or onto a cell in the deep cerebellar nuclei become eligible for plasticity only after a fixed delay from the onset of suprathreshold presynaptic activity. To investigate the proposal that the cerebellum is a general-purpose predictive controller guided by a delayed eligibility trace rule, a computer model based on the anatomy and dynamics of the cerebellum was constructed. It contained components simulating cerebellar cortex and deep cerebellar nuclei, and it received input from a middle temporal visual area and the inferior olive. The model was incorporated in a real-world brain-based device (BBD) built on a Segway robotic platform that learned to traverse curved paths. The BBD learned which visual motion cues predicted impending collisions and used this experience to avoid path boundaries. During learning, the BBD adapted its velocity and turning rate to successfully traverse various curved paths. By examining neuronal activity and synaptic changes during this behavior, we found that the cerebellar circuit selectively responded to motion cues in specific receptive fields of simulated middle temporal visual areas. The system described here prompts several hypotheses about the relationship between perception and motor control and may be useful in the development of general-purpose motor learning systems for machines.
Conflict of interest statement
Conflict of interest statement: No conflicts declared.
Figures


Similar articles
-
A bi-hemispheric neuronal network model of the cerebellum with spontaneous climbing fiber firing produces asymmetrical motor learning during robot control.Front Neural Circuits. 2014 Nov 5;8:131. doi: 10.3389/fncir.2014.00131. eCollection 2014. Front Neural Circuits. 2014. PMID: 25414644 Free PMC article.
-
Fuzzy neuronal model of motor control inspired by cerebellar pathways to online and gradually learn inverse biomechanical functions in the presence of delay.Biol Cybern. 2017 Dec;111(5-6):421-438. doi: 10.1007/s00422-017-0735-9. Epub 2017 Oct 9. Biol Cybern. 2017. PMID: 28993878
-
A neural model of cortico-cerebellar interactions during attentive imitation and predictive learning of sequential handwriting movements.Neural Netw. 2000 Oct-Nov;13(8-9):999-1046. doi: 10.1016/s0893-6080(00)00065-4. Neural Netw. 2000. PMID: 11156206
-
Physiology of the cerebellum.Handb Clin Neurol. 2018;154:85-108. doi: 10.1016/B978-0-444-63956-1.00006-0. Handb Clin Neurol. 2018. PMID: 29903454 Review.
-
Oscillations, Timing, Plasticity, and Learning in the Cerebellum.Cerebellum. 2016 Apr;15(2):122-38. doi: 10.1007/s12311-015-0665-9. Cerebellum. 2016. PMID: 25808751 Review.
Cited by
-
Cerebellar motor function in spina bifida meningomyelocele.Cerebellum. 2010 Dec;9(4):484-98. doi: 10.1007/s12311-010-0191-8. Cerebellum. 2010. PMID: 20652468 Free PMC article. Review.
-
A neuro-inspired model-based closed-loop neuroprosthesis for the substitution of a cerebellar learning function in anesthetized rats.Sci Rep. 2015 Feb 13;5:8451. doi: 10.1038/srep08451. Sci Rep. 2015. PMID: 25677559 Free PMC article.
-
Toward an Integration of Deep Learning and Neuroscience.Front Comput Neurosci. 2016 Sep 14;10:94. doi: 10.3389/fncom.2016.00094. eCollection 2016. Front Comput Neurosci. 2016. PMID: 27683554 Free PMC article.
-
Adaptive robotic control driven by a versatile spiking cerebellar network.PLoS One. 2014 Nov 12;9(11):e112265. doi: 10.1371/journal.pone.0112265. eCollection 2014. PLoS One. 2014. PMID: 25390365 Free PMC article.
-
What is value-accumulated reward or evidence?Front Neurorobot. 2012 Nov 2;6:11. doi: 10.3389/fnbot.2012.00011. eCollection 2012. Front Neurorobot. 2012. PMID: 23133414 Free PMC article.
References
Publication types
MeSH terms
LinkOut - more resources
Full Text Sources
Other Literature Sources
