

Endocytic recycling compartments altered in cisplatin-resistant cancer cells
- PMID: 16489040
- PMCID: PMC1382193
- DOI: 10.1158/0008-5472.CAN-05-3436
Endocytic recycling compartments altered in cisplatin-resistant cancer cells
Abstract
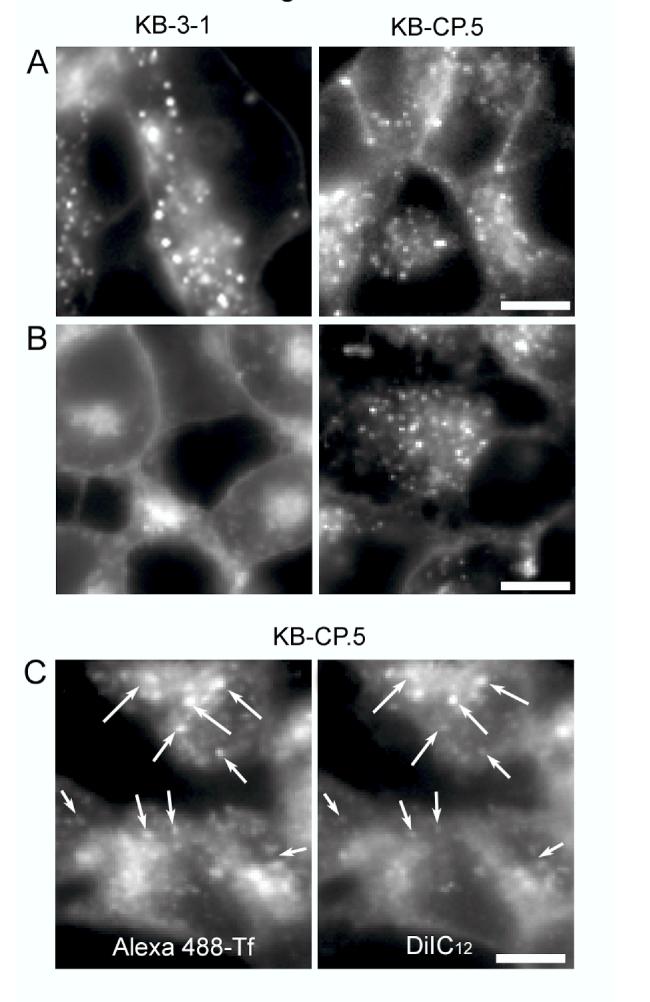
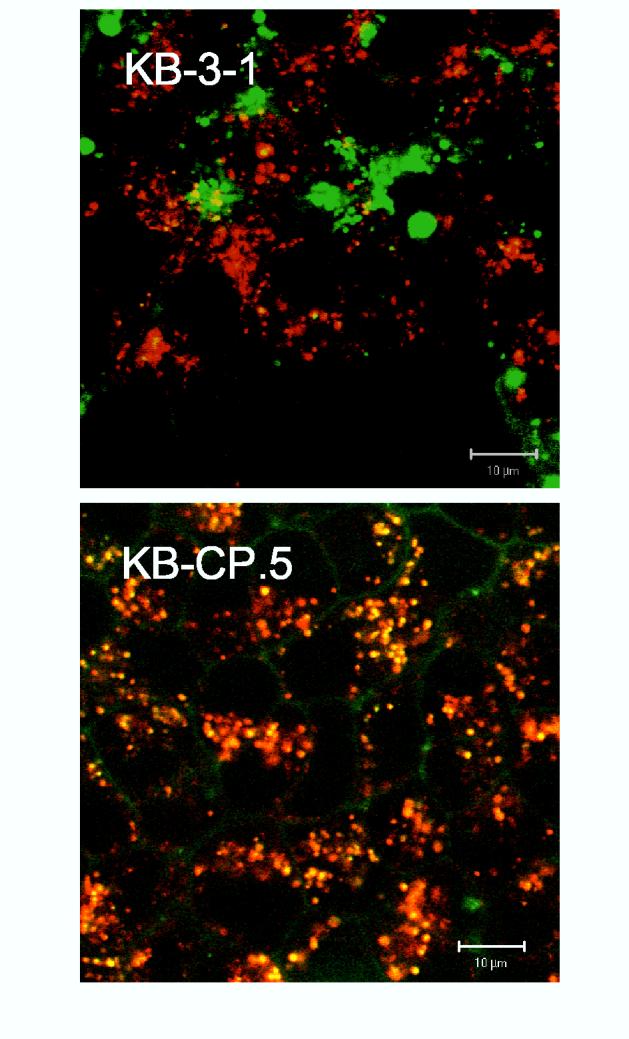
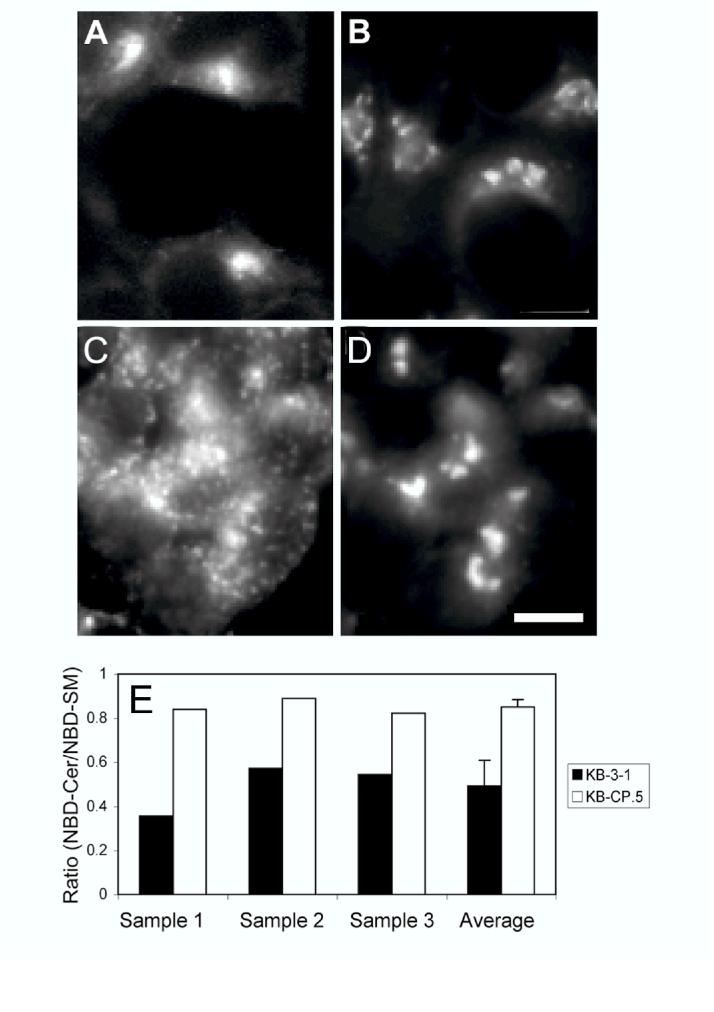
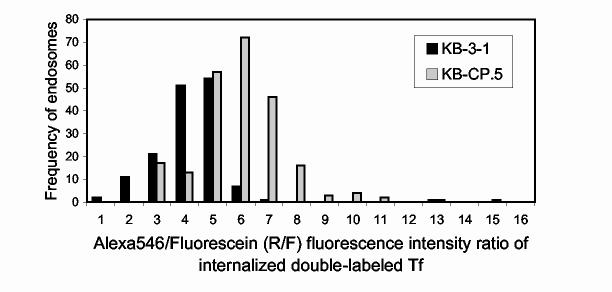
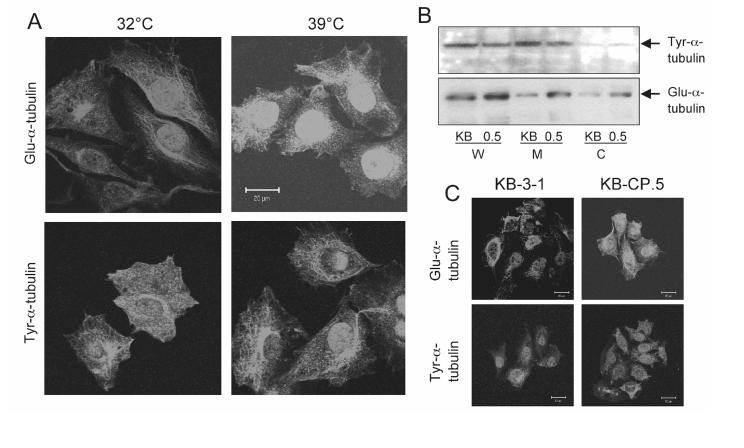
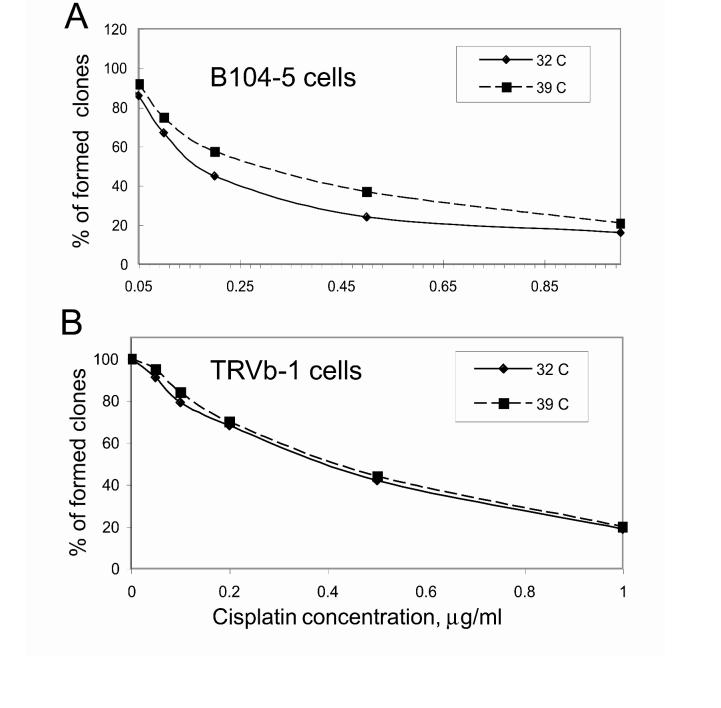
The clinical utility of cisplatin to treat human malignancies is often limited by the development of drug resistance. We have previously shown that cisplatin-resistant human KB adenocarcinoma cells that are cross-resistant to methotrexate and heavy metals have altered endocytic recycling. In this work, we tracked lipids in the endocytic recycling compartment (ERC) and found that the distribution of the ERC is altered in KB-CP.5 cells compared with parental KB-3-1 cells. A tightly clustered ERC is located near the nucleus in parental KB-3-1 cells but it appears loosely arranged and widely dispersed throughout the cytoplasm in KB-CP.5 cells. The altered distribution of the ERC in KB-CP.5 cells is related to the amount and distribution of stable detyrosinated microtubules (Glu-alpha-tubulin), as previously shown in Chinese hamster ovary B104-5 cells that carry a temperature-sensitive Glu-alpha-tubulin allele. In addition, B104-5 cells with a dispersed ERC under nonpermissive conditions were more resistant to cisplatin compared with B104-5 cells with a clustered ERC under permissive conditions. We conclude that resistance to cisplatin might be due, in part, to reduced uptake of cisplatin resulting from an endocytic defect reflecting defective formation of the ERC, possibly related to a shift in the relative amounts and distributions of stable microtubules.
Figures
Similar articles
-
Export from pericentriolar endocytic recycling compartment to cell surface depends on stable, detyrosinated (glu) microtubules and kinesin.Mol Biol Cell. 2002 Jan;13(1):96-109. doi: 10.1091/mbc.01-05-0224. Mol Biol Cell. 2002. PMID: 11809825 Free PMC article.
-
Isolation of a temperature-sensitive variant Chinese hamster ovary cell line with a morphologically altered endocytic recycling compartment.J Cell Physiol. 1993 Jun;155(3):579-94. doi: 10.1002/jcp.1041550316. J Cell Physiol. 1993. PMID: 8491793
-
Synaptotagmin IX, a possible linker between the perinuclear endocytic recycling compartment and the microtubules.J Cell Sci. 2003 Nov 1;116(Pt 21):4307-18. doi: 10.1242/jcs.00719. Epub 2003 Sep 9. J Cell Sci. 2003. PMID: 12966166
-
Reduced endocytosis and altered lysosome function in cisplatin-resistant cell lines.Br J Cancer. 2003 Apr 22;88(8):1327-34. doi: 10.1038/sj.bjc.6600861. Br J Cancer. 2003. PMID: 12698203 Free PMC article.
-
Clustering of endocytic organelles in parental and drug-resistant myeloid leukaemia cell lines lacking centrosomally organised microtubule arrays.Int J Biochem Cell Biol. 2008;40(10):2240-52. doi: 10.1016/j.biocel.2008.03.004. Epub 2008 Mar 16. Int J Biochem Cell Biol. 2008. PMID: 18439867
Cited by
-
Suppression of chloride voltage-gated channel 3 expression increases sensitivity of human glioma U251 cells to cisplatin through lysosomal dysfunction.Oncol Lett. 2018 Jul;16(1):835-842. doi: 10.3892/ol.2018.8736. Epub 2018 May 18. Oncol Lett. 2018. PMID: 29963152 Free PMC article.
-
Autophagy modulating agents as chemosensitizers for cisplatin therapy in cancer.Invest New Drugs. 2021 Apr;39(2):538-563. doi: 10.1007/s10637-020-01032-y. Epub 2020 Nov 7. Invest New Drugs. 2021. PMID: 33159673 Free PMC article. Review.
-
Cisplatin resistance: a cellular self-defense mechanism resulting from multiple epigenetic and genetic changes.Pharmacol Rev. 2012 Jul;64(3):706-21. doi: 10.1124/pr.111.005637. Epub 2012 Jun 1. Pharmacol Rev. 2012. PMID: 22659329 Free PMC article. Review.
-
Evaluation of fluorophore-tethered platinum complexes to monitor the fate of cisplatin analogs.J Biol Inorg Chem. 2015 Oct;20(7):1081-95. doi: 10.1007/s00775-015-1290-2. Epub 2015 Sep 1. J Biol Inorg Chem. 2015. PMID: 26323351 Free PMC article.
-
Cancer stem cells and their niche in the progression of squamous cell carcinoma.Cancer Sci. 2020 Nov;111(11):3985-3992. doi: 10.1111/cas.14639. Epub 2020 Sep 18. Cancer Sci. 2020. PMID: 32888236 Free PMC article. Review.
References
-
- Wang G, Reed E, Li QQ. Molecular basis of cellular response to cisplatin chemotherapy in non-small cell lung cancer. Oncol Rep. 2004;12:955–965. - PubMed
-
- Safaei R, Howell SB. Copper transporters regulate the cellular pharmacology and sensitivity to Pt drugs. Crit Rev Oncol Hematol. 2005;53:13–23. - PubMed
-
- Pinto AL, Lippard SJ. Binding of the antitumor drug cis-diamminedichloroplatinum(II) (cisplatin) to DNA. Biochim Biophys Acta. 1985;780:167–180. - PubMed
-
- Chu G. Cellular response to cisplatin: The roles of DNA binding proteins and DNA repair. J Biol Chem. 1994;269:787–90. - PubMed
Publication types
MeSH terms
Substances
Grants and funding
LinkOut - more resources
Full Text Sources
Miscellaneous
