Comparative Study
. 2006 Mar;18(3):699-714.
doi: 10.1105/tpc.105.039172. Epub 2006 Feb 17.

The Arabidopsis Aux/IAA protein family has diversified in degradation and auxin responsiveness

Affiliations
Comparative Study

The Arabidopsis Aux/IAA protein family has diversified in degradation and auxin responsiveness

Kate A Dreher et al. Plant Cell. 2006 Mar.

Abstract

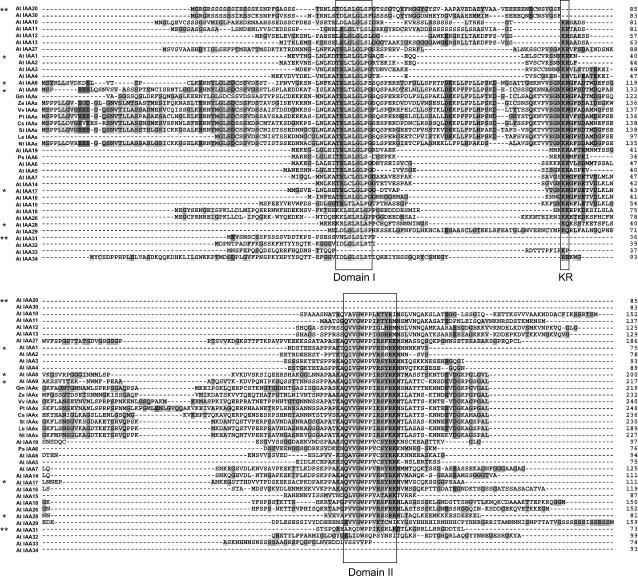
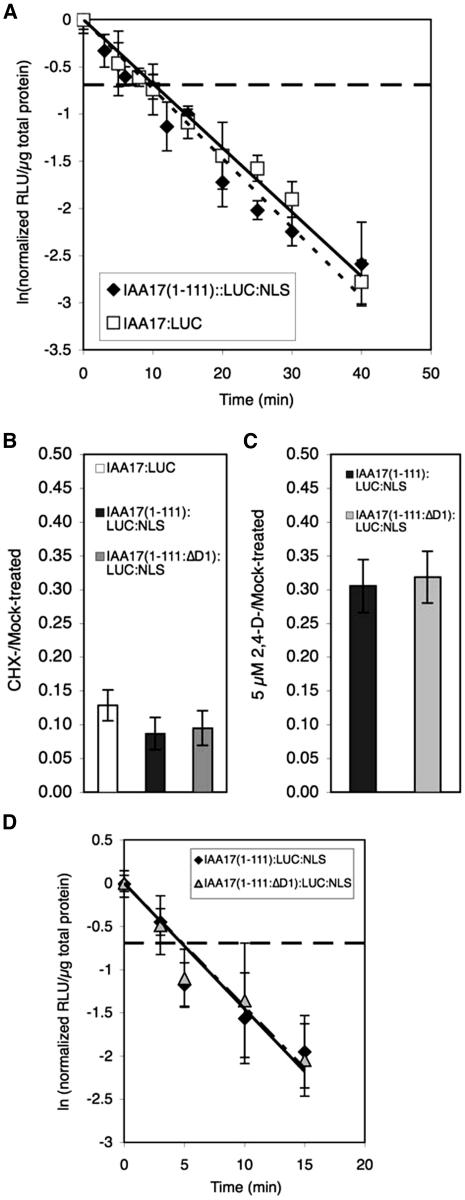
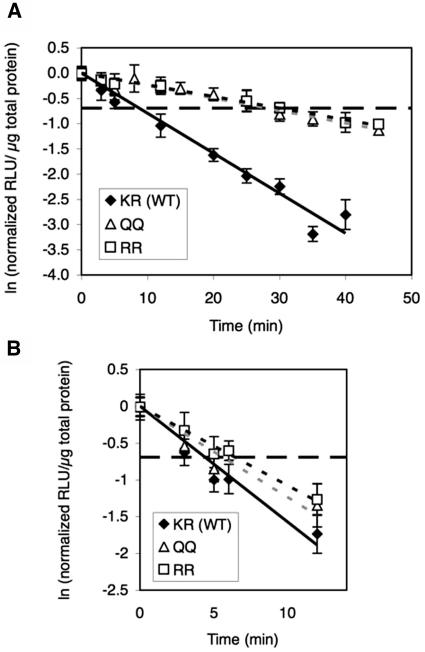
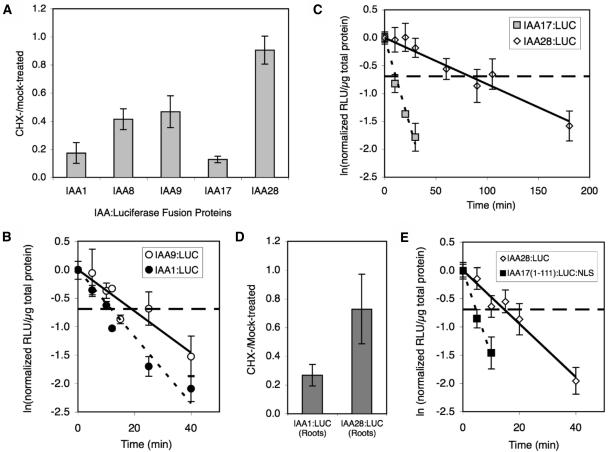
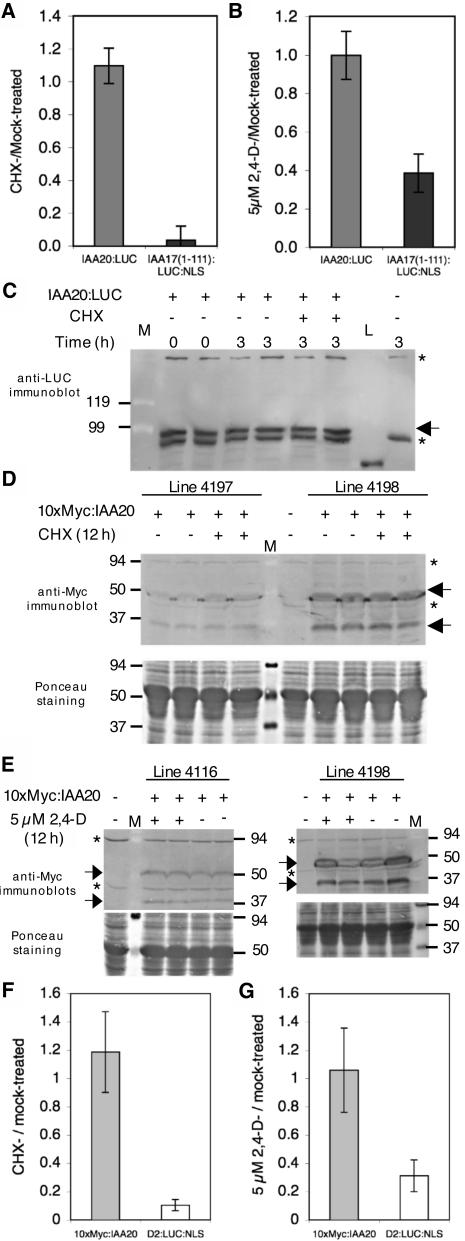
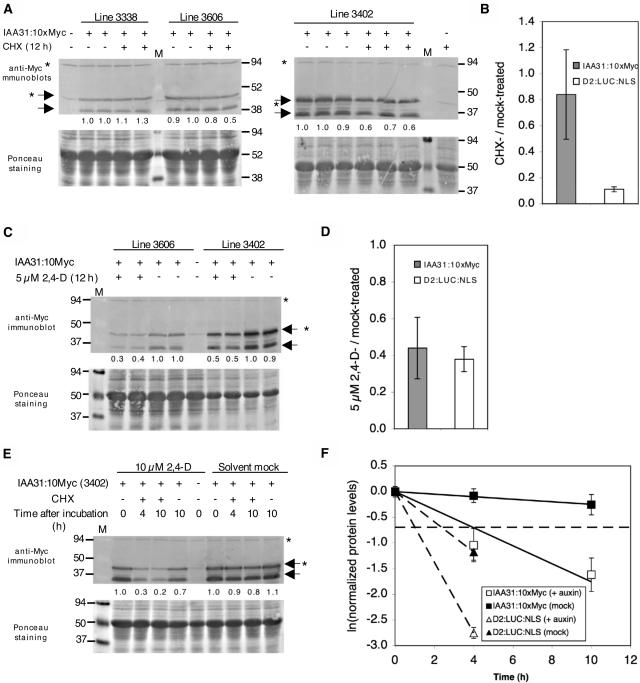
Rapid, auxin-responsive degradation of multiple auxin/indole-3-acetic acid (Aux/IAA) proteins is essential for plant growth and development. Domain II residues were previously shown to be required for the degradation of several Arabidopsis thaliana Aux/IAA proteins. We examined the degradation of additional full-length family members and the proteolytic importance of N-terminal residues outside domain II using luciferase (LUC) fusions. Elimination of domain I did not affect degradation. However, substituting an Arg for a conserved Lys between domains I and II specifically impaired basal degradation without compromising the auxin-mediated acceleration of degradation. IAA8, IAA9, and IAA28 contain domain II and a conserved Lys, but they were degraded more slowly than previously characterized family members when expressed as LUC fusions, suggesting that sequences outside domain II influence proteolysis. We analyzed the degradation of IAA31, with a region somewhat similar to domain II but without the conserved Lys, and of IAA20, which lacks domain II and the conserved Lys. Both IAA20:LUC and epitope-tagged IAA20 were long-lived, and their longevity was not influenced by auxin. Epitope-tagged IAA31 was long-lived, like IAA20, but by contrast, it showed accelerated degradation in response to auxin. The existence of long-lived and auxin-insensitive Aux/IAA proteins suggeststhat they may play a novel role in auxin signaling.


Figures

Figure 1.
Figure 1.
Alignment of Aux/IAA Family Members from the N Terminus to the Beginning of Domain III. All Aux/IAA family members from Arabidopsis (Liscum and Reed, 2002), one rapidly degraded family member from pea, and several Aux/IAA proteins from other plant species were aligned using ClustalX (version 1.8) followed by manual editing using MacClade 4.05 OS X. All amino acids from the N terminus to the amino acid just before the beginning of domain III were included. Single asterisks mark canonical family members and double asterisks mark noncanonical family members analyzed in this study. Two groups of conserved amino acids within IAA17 (underlined name), a representative canonical family member, were changed for a series of experiments (see Figures 2 and 3). Conserved domains (Abel et al., 1995; Ramos et al., 2001; Tiwari et al., 2004) are boxed and vary slightly from domain I and domain II predictions from Abel et al. (1995) and Tiwari et al. (2004). Different shades of gray highlight specific subsets of amino acids according to default parameters in ClustalX. Sequences were obtained from The Arabidopsis Information Resource (TAIR) (Arabidopsis IAAs) or were identified using BLASTP at the National Center for Biotechnology Information (other species). At, Arabidopsis thaliana; Gm, Glycine max; Ze, Zinnia elegans; Vv, Vitis vinifera; Pt, Populus tremula × Populus tremuloides; St, Solanum tuberosum; Le, Lycopersicon esculentum; Cs, Cucumis sativus; Nt, Nicotiana tabacum; Ps, Pisum sativum.
Figure 2.
Figure 2.
Degradation and Auxin Response of IAA17:LUC Fusion Proteins in Arabidopsis Seedlings. (A) IAA17:LUC (solid line) and IAA17(1-111):LUC:NLS (dashed line) fusion proteins are degraded at similar rates in Arabidopsis seedlings in a cycloheximide-based assay. Values for the y axis are derived from measurements of relative light units (RLU) of LUC activity per microgram of total plant protein (see Methods for details of measurement and calculation). The horizontal dashed line represents the value expected when half of the fusion protein has been degraded; it intersects the degradation curve at the half-life of the fusion protein (e.g., 10 min). Error bars represent sd of all samples measured at a particular time point. Data for IAA17:LUC are based upon 2 independent transgenic lines (lines) in 6 experiments (exp) with an estimated half-life of 10.1 ± 0.5 min; data for IAA17(1-111):LUC:NLS are from 3 lines, 17 exp (half-life = 9.0 ± 0.3 min). Half-lives here and in all subsequent figures are presented as ±95% confidence intervals calculated using STATA. (B) Full-length and truncated IAA17:LUC fusion proteins show similar loss of LUC activity after a 30-min incubation with cycloheximide (CHX). The values on the y axis represent the RLU/μg total protein in the cycloheximide-treated samples divided by the average RLU/μg total protein measured for all mock-treated samples in the same experiment. Error bars represent sd of all samples subjected to each treatment. Data for IAA17:LUC are from 2 lines, 6 exp; data for IAA17(1-111):LUC:NLS are from 3 lines, 8 exp; data for IAA17(1-111:ΔD1):LUC:NLS are from 3 lines, 6 exp. (C) IAA17(1-111):LUC:NLS and IAA17(1-111:ΔD1):LUC:NLS fusion proteins show similar reduction in LUC activity after a 2-h incubation with the synthetic auxin 2,4-D (5 μM). The value measured on the y axis represents the RLU/μg total protein in the 2,4-D–treated samples divided by the average RLU/μg total protein measured for all mock-treated samples in the same experiment. The samples have statistically indistinguishable ratios at P = 0.05 by Student's t test. Error bars are as described for (B). Data for IAA17(1-111):LUC:NLS are from 2 lines, 2 exp; data for IAA17(1-111:ΔD1):LUC:NLS are from 3 lines, 6 exp. (D) IAA17(1-111):LUC:NLS (solid line) and IAA17(1-111:ΔD1):LUC:NLS (dashed line) fusion proteins degrade at similar rates after a 2-h pretreatment with 5 μM 2,4-D, graphed as in (A). The 95% confidence intervals for these two lines, as determined using STATA, overlap. Data for IAA17(1-111):LUC:NLS are from 1 line, 2 exp (half-life = 4.8 ± 0.7 min); data for IAA17(1-111:ΔD1):LUC:NLS are from 1 line, 2 exp (half-life = 4.8 ± 0.7 min).
Figure 3.
Figure 3.
Degradation of Aux/IAA Fusion Proteins with Mutations in a Conserved KR Motif. (A) IAA17(1-111):LUC:NLS [KR (WT)] (solid black line) is degraded more quickly under basal conditions than IAA17(1-111:K31Q,R32Q):LUC:NLS (QQ) (gray dashed line) and IAA17(1-111:K31R):LUC:NLS (RR) (black dashed line) fusion proteins (graphed as in Figure 2A). Data for KR (WT) are from 3 lines, 8 exp (half-life = 8.8 ± 0.3 min); data for QQ are from 3 lines, 5 exp (half-life = 28.2 ± 2.6 min); data for RR are from 3 lines, 6 exp (half-life = 29.5 ± 2.3 min). (B) KR (WT), QQ, and RR fusion proteins all show similar rates of degradation after a 2-h incubation with 5 μM 2,4-D (graphed as in Figure 2A). Data for KR (WT) are from 3 lines, 8 exp (half-life = 4.6 ± 0.2 min); data for QQ are from 1 line, 2 exp (half-life = 5.6 ± 0.7 min); data for RR are from 3 lines, 5 exp (half-life = 6.4 ± 0.5 min).
Figure 4.
Figure 4.
Degradation of Canonical Aux/IAA:LUC Fusion Protein Family Members. (A) Aux/IAA:LUC fusion proteins exhibit differential loss of LUC activity after a 30-min treatment with cycloheximide (graphed as in Figure 2B). IAA8:LUC and IAA9:LUC have statistically indistinguishable ratios from each other at P = 0.05 by Student's t test. Data for IAA1:LUC are from 3 lines, 14 exp; data for IAA8:LUC are from 3 lines, 5 exp; data for IAA9:LUC are from 3 lines, 9 exp; data for IAA17:LUC are from 2 lines, 6 exp; data for IAA28:LUC are from 3 lines, 6 exp. (B) IAA9:LUC is degraded more slowly than IAA1:LUC (graphed as in Figure 2A). Data for IAA9:LUC are from 3 lines, 4 exp (half-life = 19.0 ± 2.3 min); data for IAA1:LUC are from 1 line, 2 exp (half-life = 11.8 ± 0.9 min). (C) IAA28:LUC has a half-life of >1 h in whole seedlings (graphed as in Figure 2A). Data for IAA28:LUC are from 3 lines, 13 exp (half-life = 79.3 ± 4.4 min); data for IAA17:LUC are from 1 line, 3 exp (half-life = 11.1 ± 0.9 min). (D) IAA28:LUC is degraded more slowly in roots than IAA1:LUC (graphed as in Figure 2B). The ratios are statistically different at P = 0.05 by Student's t test. Data for IAA28:LUC are from 3 lines, 7 exp; data for IAA1:LUC are from 2 lines, 5 exp. CHX, cycloheximide. (E) IAA28:LUC degradation is greatly accelerated by a 3-h treatment with 5 μM 2,4-D (graphed as in Figure 2A). Data for IAA28:LUC are from 3 lines, 8 exp (half-life = 14.8 ± 1.4 min); data for IAA17(1-111):LUC:NLS are from 2 lines, 4 exp (half-life = 4.6 ± 0.4 min).
Figure 5.
Figure 5.
Degradation and Auxin Response of the Noncanonical, Domain II–Less IAA20 Protein Fused to LUC and a Myc Epitope Tag. (A) IAA20:LUC levels do not decrease after a 12-h treatment with cycloheximide (CHX) (graphed as in Figure 2B). Data for IAA20:LUC are from 4 lines, 7 exp; data for IAA17(1-111):LUC:NLS are from 1 line, 2 exp. (B) IAA20:LUC levels do not decrease after a 12-h treatment with 5 μM 2,4-D (graphed as in Figure 2C). Data for IAA20:LUC are from 3 lines, 4 exp; data for IAA17(1-111):LUC:NLS are from 1 line, 2 exp. (C) A 3-h treatment with cycloheximide does not diminish the levels of the IAA20:LUC fusion protein or promote LUC cleavage. Immunoblot analysis was performed with anti-LUC antibodies. The arrow points to the IAA20:LUC protein. Asterisks mark nonspecific cross-reacting bands used as loading controls. Lane 1 contains markers (M), lane 8 contains recombinant LUC (L), and lane 9 contains extract from untreated wild-type Columbia seedlings. Approximate molecular masses of markers are given in kilodaltons at left. The IAA20:LUC fusion protein runs larger than its predicted size of ∼80 kD. The predicted size of LUC is ∼61 kD. There is no evidence of free LUC in the IAA20:LUC samples. (D) and (F) 10xMyc:IAA20 levels do not decrease after a 12-h treatment with cycloheximide. (D) Immunoblot analysis was performed with anti-Myc antibodies. Arrows point to two forms of the 10xMyc:IAA20 protein with different mobilities. Asterisks mark nonspecific cross-reacting bands used as loading controls. Results from two independent lines are shown (4197 and 4198), and data from a third line are included in (F). The lane without 10xMyc:IAA20 contains extract from mock-treated domain II (D2):LUC:NLS seedlings treated in parallel to verify cycloheximide effectiveness. Ponceau S staining shows total protein levels present on the membranes subjected to immunoblotting. (F) Quantification of the data shown in (D). The values on the y axis represent the average intensity of the bands in cycloheximide-treated samples divided by the average intensity of the bands for all mock-treated samples in the same experiment. Error bars represent sd of all samples subjected to each treatment. Data for 10xMyc:IAA20 are from 3 lines, 6 exp; data for D2:LUC:NLS are from 1 line, 4 exp. (E) and (G) 10xMyc:IAA20 levels do not decrease after a 12-h treatment with 5 μM 2,4-D. (E) Immunoblot analysis was performed with anti-Myc antibodies; labeling is as in (D). The lane without 10xMyc:IAA20 contains extract from mock-treated D2:LUC:NLS seedlings treated in parallel to verify 2,4-D effectiveness. Results from two independent lines are shown (4116 and 4198), and data from a third line are included in (G). (G) Quantification of the data shown in (E). The values on the y axis represent the average intensity of the bands in 2,4-D–treated samples divided by the average intensity of the bands for all mock-treated samples in the same experiment. Error bars represent sd of all samples subjected to each treatment. Data for 10xMyc:IAA20 are from 3 lines, 4 exp; data for D2:LUC:NLS are from 1 line, 2 exp.
Figure 6.
Figure 6.
Degradation and Auxin Response of the Noncanonical IAA31 Protein Fused to a Myc Epitope Tag. (A) and (B) IAA31:10xMyc levels remain relatively constant after a 12-h treatment with cycloheximide (CHX). (A) Immunoblot analysis was performed with anti-Myc antibodies. Arrows point to two forms of the IAA31:10xMyc protein with different mobilities. Asterisks mark nonspecific cross-reacting bands. The upper band was used as a loading control, and the lower band visible in Figure 5 comigrates with IAA31:10xMyc. Results from three independent lines are shown (3338, 3606, and 3402). On the blots for lines 3338 and 3402, the lanes without IAA31:10xMyc contain extract from D2:LUC:NLS seedlings used in parallel to verify cycloheximide effectiveness. Levels of immunoreactive protein were quantified and then normalized to the most intense mock-treated sample for each line; these values are listed below each lane. Both forms of IAA31:10xMyc were included in the analyses. Ponceau S staining shows total protein levels present on the membranes subjected to immunoblotting. (B) Quantification of the data shown in (A) (graphed as in Figure 5F). Data for IAA31:10xMyc are from 3 lines, 7 exp; data for D2:LUC:NLS are from 1 line, 3 exp. (C) and (D) IAA31:10xMyc levels decrease after a 12-h treatment with 5 μM 2,4-D. (C) Immunoblot analysis was performed with anti-Myc antibodies; labeling is as described for (A). The lane without IAA31:10xMyc contains extract from mock-treated D2:LUC:NLS seedlings used in a parallel control experiment. Results from two independent lines are shown (3606 and 3402), and data from a third line are included in (D). Higher levels of total protein were loaded for line 3606 because it had lower levels of IAA31:10xMyc expression. Bands from two representative experiments were quantified and normalized as described for (A); their values are shown below the immunoblot. (D) Quantification of the data shown in (C) (graphed as in Figure 5G). Data for IAA31:10xMyc are from 3 lines, 4 exp; data for D2:LUC:NLS are from 1 line, 3 exp. (E) and (F) IAA31:10xMyc degrades much more rapidly after a 2-h incubation with 10 μM 2,4-D. (E) Immunoblot analysis was performed with anti-Myc antibodies; labeling is as described for (A). The lane without IAA31:10xMyc contains extract from mock-treated D2:LUC:NLS seedlings used in a parallel control experiment. Bands were quantified as described for (A) and normalized to the 0-h time point for each treatment; their values are shown below each lane. (F) Quantification of IAA31:10xMyc protein loss over time (graphed as in Figure 2A). For IAA31:10xMyc, normalized protein levels are based on band intensities of immunoreactive proteins, whereas for D2:LUC:NLS, normalized protein levels are based on RLU/μg total protein, as described for Figure 2A. Data for IAA31:10xMyc are from 1 line, 2 exp; data for D2:LUC:NLS are from 1 line, 2 exp.

References

    1. Abel, S., Nguyen, M.D., and Theologis, A. (1995). The PSIAA4/5-like family of early auxin-inducible mRNAs in Arabidopsis thaliana. J. Mol. Biol. 251 533–549. - PubMed
    1. Abel, S., Oeller, P.W., and Theologis, A. (1994). Early auxin-induced genes encode short-lived nuclear proteins. Proc. Natl. Acad. Sci. USA 91 326–330. - PMC - PubMed
    1. Abel, S., and Theologis, A. (1995). A polymorphic bipartite motif signals nuclear targeting of early auxin-inducible proteins related to PSIAA4 from pea (Pisum sativum). Plant J. 8 87–96. - PubMed
    1. Balint, E., Bates, S., and Vousden, K.H. (1999). Mdm2 binds p73 alpha without targeting degradation. Oncogene 18 3923–3929. - PubMed
    1. Blanc, G., Barakat, A., Guyot, R., Cooke, R., and Delseny, M. (2000). Extensive duplication and reshuffling in the Arabidopsis genome. Plant Cell 12 1093–1101. - PMC - PubMed

Publication types

MeSH terms

Associated data