. 2006 Apr;172(4):2665-81.
doi: 10.1534/genetics.105.048975. Epub 2006 Feb 19.

A simple and robust statistical test for detecting the presence of recombination

Affiliations

A simple and robust statistical test for detecting the presence of recombination

Trevor C Bruen et al. Genetics. 2006 Apr.

Abstract

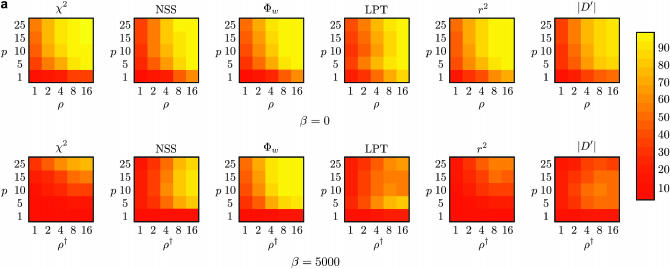
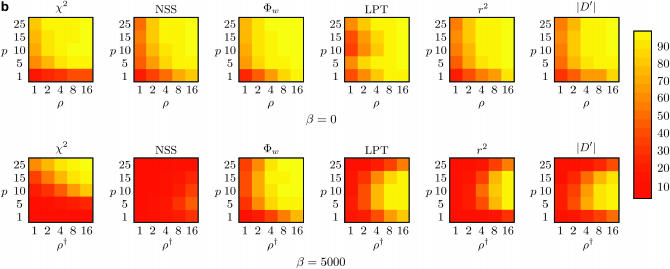
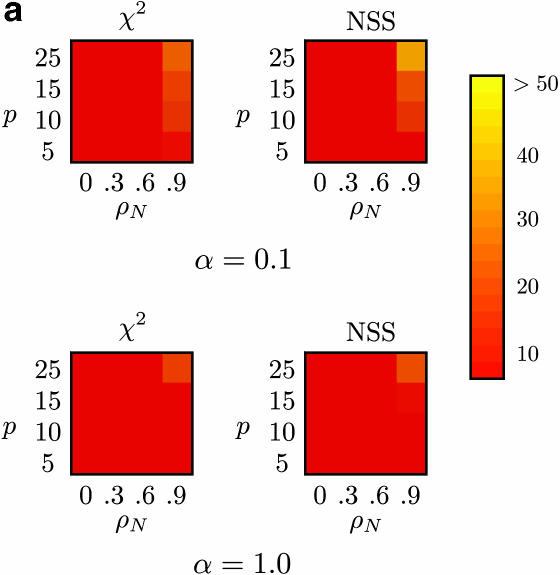
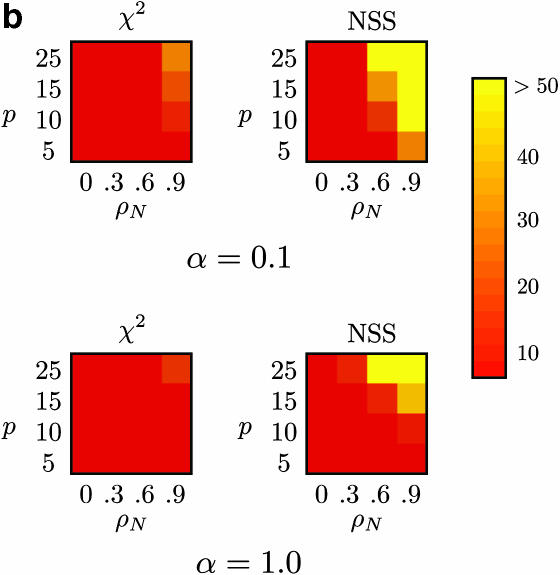
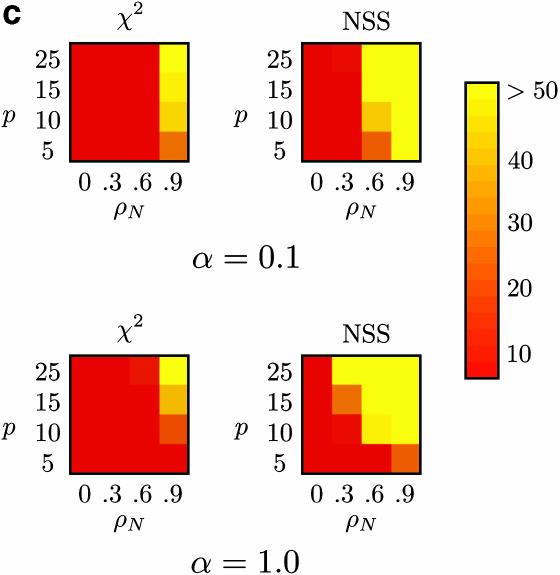
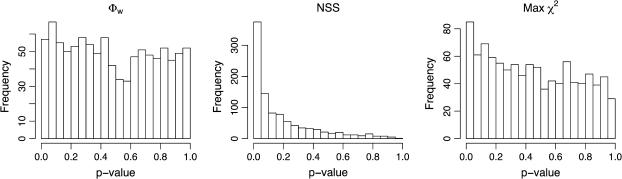
Recombination is a powerful evolutionary force that merges historically distinct genotypes. But the extent of recombination within many organisms is unknown, and even determining its presence within a set of homologous sequences is a difficult question. Here we develop a new statistic, phi(w), that can be used to test for recombination. We show through simulation that our test can discriminate effectively between the presence and absence of recombination, even in diverse situations such as exponential growth (star-like topologies) and patterns of substitution rate correlation. A number of other tests, Max chi2, NSS, a coalescent-based likelihood permutation test (from LDHat), and correlation of linkage disequilibrium (both r2 and /D'/) with distance, all tend to underestimate the presence of recombination under strong population growth. Moreover, both Max chi2 and NSS falsely infer the presence of recombination under a simple model of mutation rate correlation. Results on empirical data show that our test can be used to detect recombination between closely as well as distantly related samples, regardless of the suspected rate of recombination. The results suggest that phi(w) is one of the best approaches to distinguish recurrent mutation from recombination in a wide variety of circumstances.


Figures

Figure 1.
Figure 1.
The dual nature of incompatibility. Two possible histories for a pair of incompatible sites are shown: (a) two incompatible sites explained by a recombination event and (b) two incompatible sites explained by a convergent mutation. Mutations in the first site are indicated by open circles and mutations in the second site are indicated by solid circles. To explain the incompatibility between the pair of sites either a recombination event must be invoked or a homoplasy must have occurred in the history of one of the sites.
Figure 1.
Figure 1.
The dual nature of incompatibility. Two possible histories for a pair of incompatible sites are shown: (a) two incompatible sites explained by a recombination event and (b) two incompatible sites explained by a convergent mutation. Mutations in the first site are indicated by open circles and mutations in the second site are indicated by solid circles. To explain the incompatibility between the pair of sites either a recombination event must be invoked or a homoplasy must have occurred in the history of one of the sites.
Figure 2.
Figure 2.
The entries marked with a diamond in the refined incompatibility matrix represent the cells used to calculate the pairwise homoplasy index (or Φw). The cells with light shading contain the refined incompatibility score of informative site i with informative site i + 1. The cells with dark shading contain the refined incompatibility score of informative site i with informative site i + 2. In this example sites up to 2 informative bases apart are used to calculate Φw.
Figure 3.
Figure 3.
Comparison of P-values obtained using the permutation test (horizontal axis) to analytical P-values (vertical axis) when ρ = 0 and β = 0. Points with <15 samples and <10% sequence divergence are not shown (see Table 2).
Figure 4.
Figure 4.
Power to detect recombination for (a) m = 10 and (b) m = 50 samples for six different methods with (a and b, bottom rows) and without (a and b, top rows) population growth. The horizontal axis varies the rate of recombination whereas the vertical axis varies the amount of sequence diversity. Each cell represents the outcome of 1000 replicates with cells with lighter shading indicating increased power. The value ρ refers to the value of ρ used to give the same expected number of recombinations under population growth.
Figure 4.
Figure 4.
Power to detect recombination for (a) m = 10 and (b) m = 50 samples for six different methods with (a and b, bottom rows) and without (a and b, top rows) population growth. The horizontal axis varies the rate of recombination whereas the vertical axis varies the amount of sequence diversity. Each cell represents the outcome of 1000 replicates with cells with lighter shading indicating increased power. The value ρ refers to the value of ρ used to give the same expected number of recombinations under population growth.
Figure 5.
Figure 5.
Percentage of false positives for (a) m = 10 samples (with β = 5000), (b) m = 50 samples (with β = 0), and (c) m = 50 samples (with β = 5000), for Max χ2 and NSS, with extreme rate heterogeneity (top row) and moderate rate heterogeneity (bottom row). The horizontal axis varies the substitution rate correlation whereas the vertical axis varies the amount of sequence diversity. Each cell represents the outcome of 1000 replicates with cells with lighter shading indicating a higher percentage of false positives. The results for Φw, r2, and |D′| are omitted since these approaches did not falsely infer recombination >7% of the time for any of the conditions, but Table 4 shows a number of these results for Φw.
Figure 5.
Figure 5.
Percentage of false positives for (a) m = 10 samples (with β = 5000), (b) m = 50 samples (with β = 0), and (c) m = 50 samples (with β = 5000), for Max χ2 and NSS, with extreme rate heterogeneity (top row) and moderate rate heterogeneity (bottom row). The horizontal axis varies the substitution rate correlation whereas the vertical axis varies the amount of sequence diversity. Each cell represents the outcome of 1000 replicates with cells with lighter shading indicating a higher percentage of false positives. The results for Φw, r2, and |D′| are omitted since these approaches did not falsely infer recombination >7% of the time for any of the conditions, but Table 4 shows a number of these results for Φw.
Figure 6.
Figure 6.
Distribution of P-values inferred by the Φw-statistic, the NSS statistic, and the Max χ2-statistic. The results are obtained on the basis of 1000 parametric bootstraps under conditions observed for the Boletales example. None of the replicates contained recombination but the substitution rate autocorrelation was set to ρN = 0.35 and substitution rate heterogeneity was set to α = 1.31.

References

    1. Anderson, J. B., C. Wickens, M. Khan, L. E. Cowen, N. Federspiel et al., 2001. Infrequent genetic exchange and recombination in the mitochondrial genome of Candida albicans. J. Bacteriol. 183(3): 865–872. - PMC - PubMed
    1. Awadalla, P., 2003. The evolutionary genomics of pathogen recombination. Nat. Rev. Genet. 4(1): 50–60. - PubMed
    1. Awadalla, P., A. Eyre-Walker and J. M. Smith, 1999. Linkage disequilibrium and recombination in hominid mitochondrial DNA. Science 286(5449): 2524–2525. - PubMed
    1. Brown, C. J., E. C. Garner, A. Keith Dunker and P. Joyce, 2001. The power to detect recombination using the coalescent. Mol. Biol. Evol. 18(7): 1421–1424. - PubMed
    1. Bruen, T., and D. Bryant, 2006. A subdivision approach to maximum parsimony. Ann. Combinator. (in press).

Publication types