. 2006 Mar;3(3):183-9.
doi: 10.1038/nmeth859.

A pooling-deconvolution strategy for biological network elucidation

Affiliations

A pooling-deconvolution strategy for biological network elucidation

Fulai Jin et al. Nat Methods. 2006 Mar.

Abstract

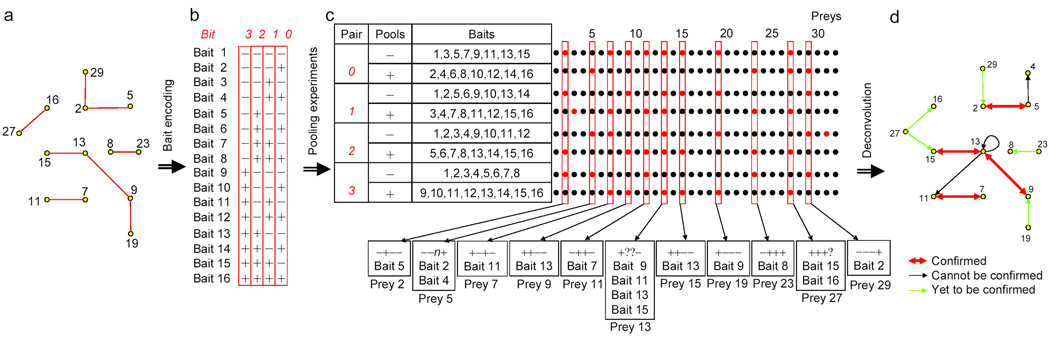
The generation of large-scale data sets is a fundamental requirement of systems biology. But despite recent advances, generation of such high-coverage data remains a major challenge. We developed a pooling-deconvolution strategy that can dramatically decrease the effort required. This strategy, pooling with imaginary tags followed by deconvolution (PI-deconvolution), allows the screening of 2(n) probe proteins (baits) in 2 x n pools, with n replicates for each bait. Deconvolution of baits with their binding partners (preys) can be achieved by reading the prey's profile from the 2 x n experiments. We validated this strategy for protein-protein interaction mapping using both proteome microarrays and a yeast two-hybrid array, demonstrating that PI-deconvolution can be used to identify interactions accurately with fewer experiments and better coverage. We also show that PI-deconvolution can be used to identify protein-small molecule interactions inferred from profiling the yeast deletion collection. PI-deconvolution should be applicable to a wide range of library-against-library approaches and can also be used to optimize array designs.


Figures

Figure 1
Figure 1
Scheme for PI-Deconvolution. (a) Graph representation of a hypothetical 32-protein network. Yellow filled circles, proteins (nodes); red lines, interactions (edges). For simplicity, only nodes and edges concerning proteins 1–16 are shown. (b) Proteins 1–16 are used as the first batch of baits to identify their preys. The total 32 proteins can be covered similarly with a second batch of experiments. We encode each bait with a 4-bit +/− string (imaginary coding tag); four bits are enough to uniquely encode 16 (=24) baits. Thus, n bits can encode 2n distinct baits. (c) We prepare 4 pairs of bait pools numbered from 0–3, corresponding to each of the 4 bits. Every pair contains a “+” pool and a “−” pool, each employing 8 baits (half the batch size). Altogether, there will be 8 (2n) experiments (rows) – instead of 16 (2n) – to identify all interacting preys. Each column represents profile of a prey; positive signal (red), negative signal (black). All valid preys (columns outlined in red) and their possible baits are listed. If a prey binds to only one bait in a batch, the prey should be detected only once in each pair of experiments. We use degenerate profile “n” or “?” to indicate neither or both experiments in a pair give a positive call (such as prey 5 or prey 13). Preys with degenerate profiles can still be partially deconvoluted and further narrowing-down can be achieved by reciprocal confirmation. (d) A graph can be drawn according to the result in c.
Figure 2
Figure 2
PI-Deconvolution applied to protein interaction mapping. (a) Yeast proteome microarray screening. 15 bait proteins are encoded as shown and 8 bait pools are prepared accordingly (see also Supplementary Table 1 online). Each image column represents the result of a pooling screen, and each image row represents the same spot of the array. A positive signal indicates the presence of one or more binding proteins in the pool. Signals from “+” pools are false-colored red and “−” pools green. For example, the prey spots representing CMD1 (first row) were positive when probed with the “+” pools of pairs 1 and 2 (in red), and the “−” pools of pairs 0 and 3 (in green). The profile of CMD1 is thus read as “−++−”, which equals the encoding tag for the bait CMK1. The results obtained by the PI-Deconvolution analysis (using 8 arrays) are identical to those obtained from single-bait probing (using 15 arrays). Only reciprocally confirmed interactions (red bidirectional arrows) and self interactions (black arrows) are shown (bottom). Detailed explanation of hit recognition is described in Methods. (b) Yeast two-hybrid array screening. Encoding and pooling schemes of 16 bait strains are shown in Supplementary Table 2 online. The whole library array consists of 16 plates with 384 strains each. Shown are images of one representative library plate screened with 16 baits using PI-Deconvolution; each image is the result of a pooling screen with 8 baits.
Figure 3
Figure 3
PI-Deconvolution applied to drug resistance screening of 128 (=27) yeast deletion strains in 14 pools (64 strains per pool). Designated drug resistant strains (fpr1Δ for rapamycin and ppg1Δ for wortmannin32) are correctly deconvoluted.
Figure 4
Figure 4
PI-Deconvolution simulated on yeast interactome (DIP). We assume that all interactions in DIP are correct. Only the interactions that are confirmed reciprocally or after bait-reshuffling are accepted. Both accuracy (fraction of true interactions among the detected ones; blue curves) and coverage (fraction of true interactions detected; red curves) are calculated for interactions between proteins with different node degrees (X-axis). For example, blue and red curves with X-axis value 0–24 showed accuracy and coverage of PI-Deconvolution for interactions between nodes with degrees no more than 24. The curves with “x” indicate the accuracy and coverage by duplicated single bait screening, where only reproducible hits are accepted. We assume 40% of the hits from each array experiment are false positives (FP), and each array experiment will lose 40% of true positives (FN). (a) PI-Deconvolution simulated using BitNum=5 (n=5; 16 baits per pool) and CutOcc=2 (only hits that show up at least twice are accepted). (b) PI-Deconvolution simulated using BitNum=6 (n=6; 32 baits per pool) and CutOcc=2.

Comment in

References

    1. Phizicky E, Bastiaens PI, Zhu H, Snyder M, Fields S. Protein analysis on a proteomic scale. Nature. 2003;422:208–215. - PubMed
    1. Uetz P, et al. A comprehensive analysis of protein-protein interactions in Saccharomyces cerevisiae. Nature. 2000;403:623–627. - PubMed
    1. Ito T, et al. Toward a protein-protein interaction map of the budding yeast: A comprehensive system to examine two-hybrid interactions in all possible combinations between the yeast proteins. Proc Natl Acad Sci U S A. 2000;97:1143–1147. - PMC - PubMed
    1. Giot L, et al. A protein interaction map of Drosophila melanogaster. Science. 2003;302:1727–1736. - PubMed
    1. Li S, et al. A map of the interactome network of the metazoan C. elegans. Science. 2004;303:540–543. - PMC - PubMed

Publication types

MeSH terms