Review
. 2005 Oct;2(4):554-71.
doi: 10.1602/neurorx.2.4.554.

Drug metabolism and pharmacokinetics, the blood-brain barrier, and central nervous system drug discovery

Affiliations
Review

Drug metabolism and pharmacokinetics, the blood-brain barrier, and central nervous system drug discovery

Mohammad S Alavijeh et al. NeuroRx. 2005 Oct.

Abstract

The worldwide market for therapies for CNS disorders is worth more than 50 billion dollars and is set to grow substantially in the years ahead. This is because: 1) the incidence of many CNS disorders (e.g., Alzheimer's disease, stroke, and Parkinson's disease) increase exponentially after age 65 and 2) the number of people in the world over 65 is about to increase sharply because of a marked rise in fertility after World War II. However, CNS research and development are associated with significant challenges: it takes longer to get a CNS drug to market (12-16 years) compared with a non-CNS drug (10-12 years) and there is a higher attrition rate for CNS drug candidates than for non-CNS drug candidates. This is attributable to a variety of factors, including the complexity of the brain, the liability of CNS drugs to cause CNS side effects, and the requirement of CNS drugs to cross the blood-brain barrier (BBB). This review focuses on BBB penetration, along with pharmacokinetics and drug metabolism, in the process of the discovery and development of safe and effective medicines for CNS disorders.


Figures

FIG. 1.
FIG. 1.
Cumulative success rates of drugs to market by therapeutic area. Source: IMS International.
FIG. 2.
FIG. 2.
Concentration-time profile in plasma following both oral and intravenous administration. Following oral administration, Tmax is the time take to achieve the maximal concentration and Cmax is the maximal concentration achieved. After intravenous administration, C0 is the extrapolated concentration at t = 0. AUC represents a measure of total drug exposure.
FIG. 3.
FIG. 3.
Mechanisms by which molecules move across the blood-brain barrier. 1: The free concentration of a compound in blood is determined by its ADME properties, together with the extent of protein binding. 2: Influx mechanisms include: a) carrier- mediated influx (e.g., glucose, amines, amino acids, monocarboxylates, nucleosides, and small peptides), b) Receptor-mediated transcytosis (e.g., insulin and transferring), c) Absorptive-mediated transcytosis (e.g., avidin, catonized albumin and histones), d) Tight junction-mediated modulation (e.g., polar solutes). 3: Passive diffusion occurs on the basis of the physicochemical properties of molecules (see Table 8). 4: Egress transporters are able to expel a large number of chemically diverse compounds from brain interstitial fluid. BBB egress transporters include ABCB1 (multiple hydrophilic/ampiphilic, planer compounds), ABCB5, ABCC1 (anionic conjugates with glutathione, sulphate and gluconsyl, GSSH, and X-GSH), ABCC2 (anionic conjugates with glutathione), ABCC5 (organic ions, nucleotide analogs, cyclic nucleotides), ABCG2 (numerous compounds). The ABCB subfamily contains the MDR proteins, of which P-glycoprotein (P-gp) is the prototypic example. 5: A compound in the interstitial fluid can be adsorbed into brain tissue, distributed throughout the brain, metabolized by brain enzymes, or eliminated via ventricular CSF.
FIG. 4.
FIG. 4.
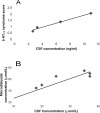
Concentration of compounds ventricular CSF correlates with A) behavior and B) interstitial concentrations. A: The relationship between the concentration of a 5-HT1A antagonist (WAY-100635) and an assessment of the behavioral syndrome evoked by the 5-HT1A agonist 8-hydroxy-2-(di-n-propylamino)tetralin (8-OH-DPAT). B: The concentration of lamotrigine in ventricular CSF and brain interstitial fluid correlate (Alavijeh, M. S., and A. M. Palmer, unpublished observations).
FIG. 5.
FIG. 5.
Interstitial fluid is the key compartment for the action of a neuroactive compound.
FIG. 6.
FIG. 6.
In vivo and in vitro brain penetration profile of compounds that are P-gp substrates (cimetidine and morphine) with those that are not (antipyrine, caffeine, and warfarine); zidovudine (3′-azido-3′-deoxythymidine; AZT) was excluded because it appears to be effluxed out of the brain by transporters other than P-gp.80 In vivo measures represent ratios between area under curve (AUC) obtained in brain and blood using microdialysis (AUCbrain/AUCblood. In vitro data represent ratios between Papp obtained in vitro for the apical to basolateral (Ap > B1) and basolateral to apical (B1 > Ap) directions. Data derived from Table 16 of Ref. .

References

    1. Palmer AM, DeKosky ST. Neurochemistry of ageing. In: Principles and practice of geriatric medicine (Pathy MSJ, ed), Ed 4, pp 65–76. London, UK: Wiley Ltd., 1998.
    1. Is the pharma industry weathering the ‘perfect storm’? IMS Health, 17 March 2003.
    1. Philips SP, Mackintosh A. Beyond 2005. the future of pharmaceutical marketing and sale. Perspective on life sciences. Special edition. Chichester, Sussex, UK: Ernst & Young, 2002.
    1. Sneader W. Drug discovery—a history. Chichester, Sussex, UK: Wiley, 2005.
    1. Snyder SH. Drugs and the brain. New York: Palmgrave Publishers-The Scientific American Library, 1996.

Substances