. 2006 Apr 14;357(5):1449-70.
doi: 10.1016/j.jmb.2006.01.034. Epub 2006 Feb 2.

Probing molecular docking in a charged model binding site

Affiliations

Probing molecular docking in a charged model binding site

Ruth Brenk et al. J Mol Biol. .

Abstract

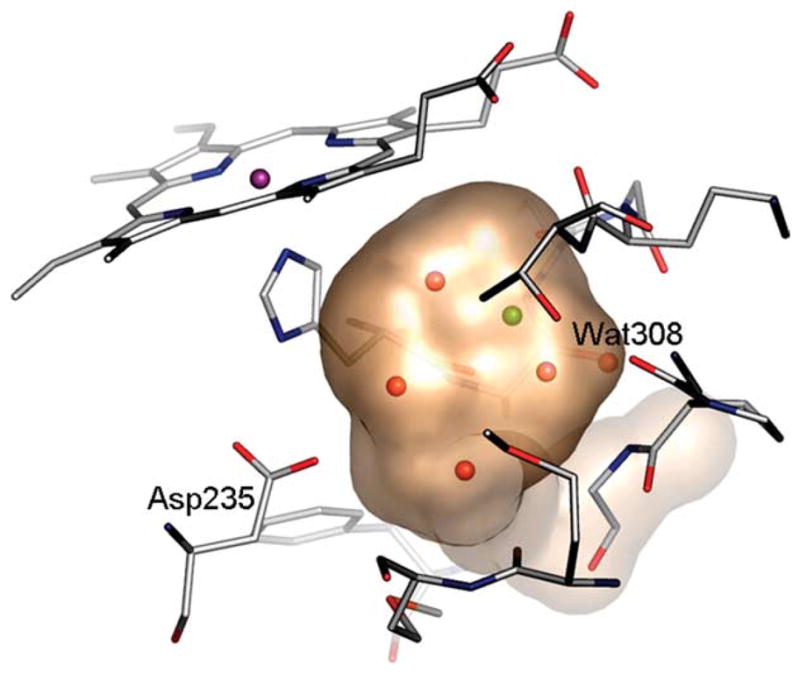
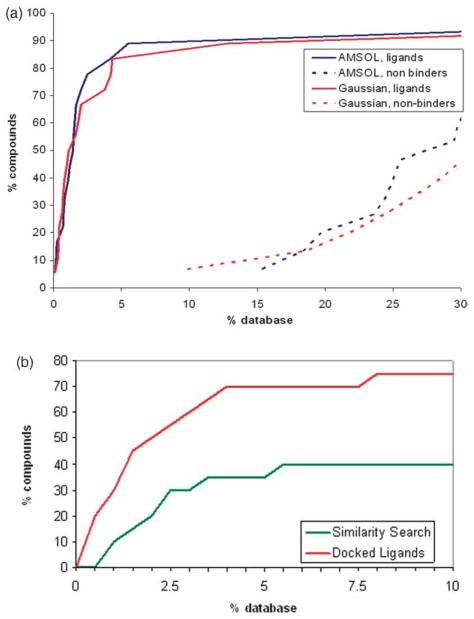
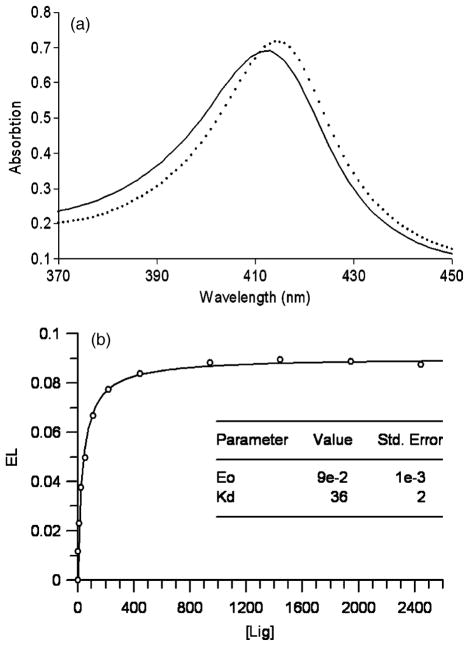
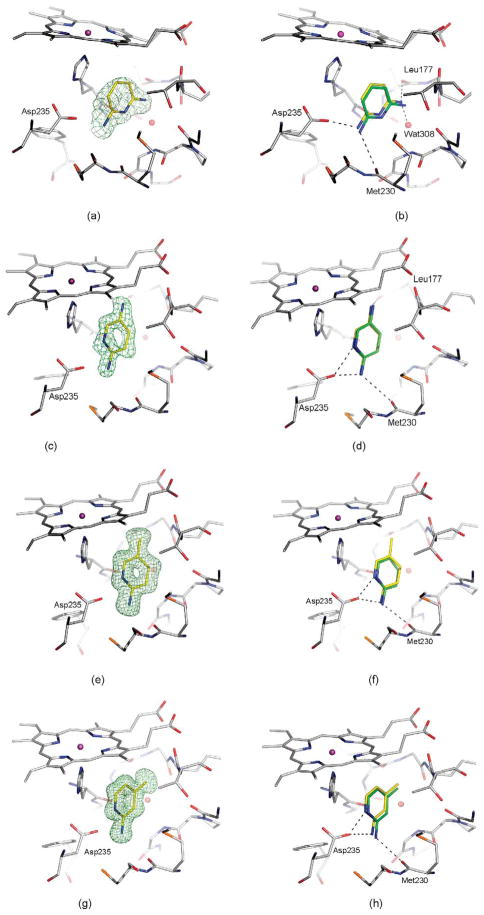
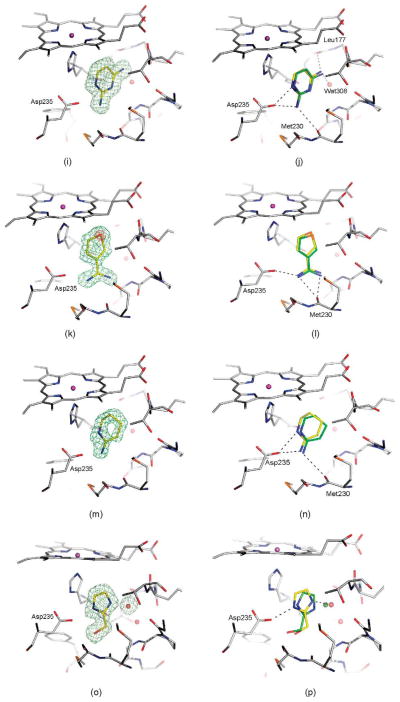
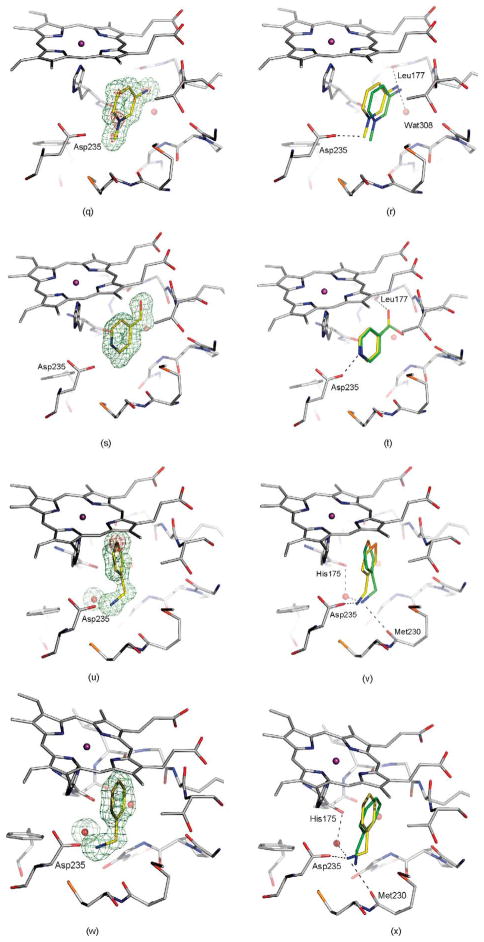
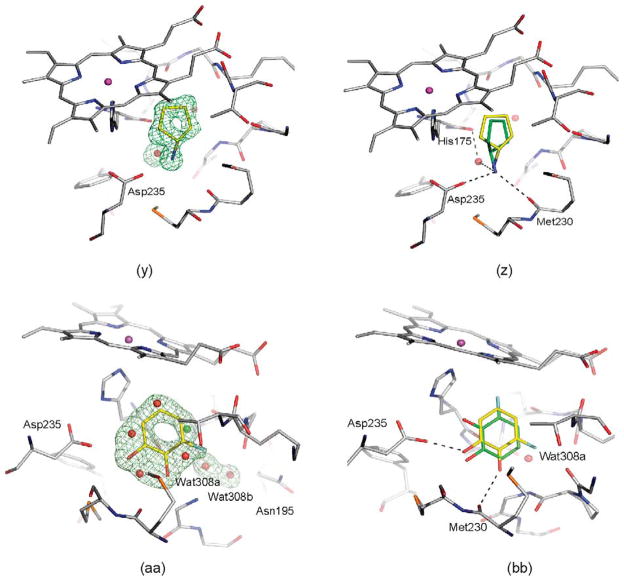
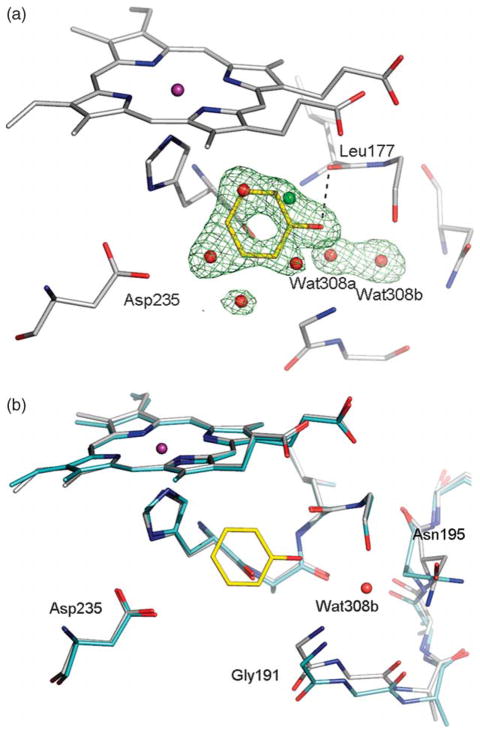
A model binding site was used to investigate charge-charge interactions in molecular docking. This simple site, a small (180A(3)) engineered cavity in cyctochrome c peroxidase (CCP), is negatively charged and completely buried from solvent, allowing us to explore the balance between electrostatic energy and ligand desolvation energy in a system where many of the common approximations in docking do not apply. A database with about 5300 molecules was docked into this cavity. Retrospective testing with known ligands and decoys showed that overall the balance between electrostatic interaction and desolvation energy was captured. More interesting were prospective docking scre"ens that looked for novel ligands, especially those that might reveal problems with the docking and energy methods. Based on screens of the 5300 compound database, both high-scoring and low-scoring molecules were acquired and tested for binding. Out of 16 new, high-scoring compounds tested, 15 were observed to bind. All of these were small heterocyclic cations. Binding constants were measured for a few of these, they ranged between 20microM and 60microM. Crystal structures were determined for ten of these ligands in complex with the protein. The observed ligand geometry corresponded closely to that predicted by docking. Several low-scoring alkyl amino cations were also tested and found to bind. The low docking score of these molecules owed to the relatively high charge density of the charged amino group and the corresponding high desolvation penalty. When the complex structures of those ligands were determined, a bound water molecule was observed interacting with the amino group and a backbone carbonyl group of the cavity. This water molecule mitigates the desolvation penalty and improves the interaction energy relative to that of the "naked" site used in the docking screen. Finally, six low-scoring neutral molecules were also tested, with a view to looking for false negative predictions. Whereas most of these did not bind, two did (phenol and 3-fluorocatechol). Crystal structures for these two ligands in complex with the cavity site suggest reasons for their binding. That these neutral molecules do, in fact bind, contradicts previous results in this site and, along with the alkyl amines, provides instructive false negatives that help identify weaknesses in our scoring functions. Several improvements of these are considered.


Figures

Figure 1
Figure 1
The cavity in CCP W191G. A transparent surface is displayed showing four ordered water molecules (red) and one potassium ion (green) in the cavity of the apo-structure. Water molecule 308 is conserved in all structures. (This Figure was made using PyMOL (www.pymol.org, as were Figures 4 and 5).)
Figure 2
Figure 2
Retrospective enrichment of previously known, “test set” ligands for the W191G cavity in CCP.– (a) Using molecular docking, looking at enrichment of known ligands (continuous lines) and downgrading of known decoys (broken lines) with either AMSOL-based (blue curve) or Gaussian-based ligand partial charges and desolvation energies. (b) The hit-rate for finding the docking-derived novel ligands had we used chemical similarity to the previously known ligands. The enrichment for the docking-based enrichment against the same database is also shown for comparison.
Figure 3
Figure 3
(a) Binding of cationic ligands induces a red shift in the Soret band (continuous line: spectra of the unbound, protein, broken line: spectra if a ligand is bound (here 18)). (b) Titration curve for 18. The continuous line represents the least-squares fit of the data according to the equation for single site binding described in Methods.
Figure 4
Figure 4
Crystal structures of selected ligands from Table 2 bound to CCP W191G. Left column: |Fo|−|Fc| omit map for the refined complexes, except for (a), (c), (k), (m), and (y) where the map of the unrefined complex is shown, contoured at 2.5σ (green) with the ligand left out of the calculation, but shown in the Figure for clarity. Right column: Superposition of the highest ranking dock pose (green carbon atoms) with the crystallographically determined binding mode (yellow carbon atoms). Hydrogen bonds are drawn as broken lines. (a) and (b) 14; (c) and (d) 15; (e) and (f) 16; (g) and (h) 17; (i) and (j) 18; (k) and (l) 21, the |Fo|−|Fc| map, contoured at 10σ (red) is also shown; (m) and (n) 22; (o) and(p) 24; (q) and (r) 25, the |Fo|−|Fc| map, contoured at 9σ (red) is also shown; (s) and (t) 28; (u) and (v) 33, the |Fo|−|Fc| map, contoured at 14σ (red) is also shown; (w) and (x) 34; (y) and (z) 35; (aa) and (bb) 36.
Figure 4
Figure 4
Crystal structures of selected ligands from Table 2 bound to CCP W191G. Left column: |Fo|−|Fc| omit map for the refined complexes, except for (a), (c), (k), (m), and (y) where the map of the unrefined complex is shown, contoured at 2.5σ (green) with the ligand left out of the calculation, but shown in the Figure for clarity. Right column: Superposition of the highest ranking dock pose (green carbon atoms) with the crystallographically determined binding mode (yellow carbon atoms). Hydrogen bonds are drawn as broken lines. (a) and (b) 14; (c) and (d) 15; (e) and (f) 16; (g) and (h) 17; (i) and (j) 18; (k) and (l) 21, the |Fo|−|Fc| map, contoured at 10σ (red) is also shown; (m) and (n) 22; (o) and(p) 24; (q) and (r) 25, the |Fo|−|Fc| map, contoured at 9σ (red) is also shown; (s) and (t) 28; (u) and (v) 33, the |Fo|−|Fc| map, contoured at 14σ (red) is also shown; (w) and (x) 34; (y) and (z) 35; (aa) and (bb) 36.
Figure 5
Figure 5
(a) |Fo|−|Fc| omit map of the refined phenol-CCP W191G complex contoured at 3.0σ, calculated with the ligand and the potassium ion and the cavity water molecules left out. The occupancy of the ligand was refined to 62%, that of Wat308b to 64%, that of Wat308a to 36%, and the occupancies of the remaining water molecules to 38%. (b) Superposition of the apo-structure (carbon atoms colored in cyan) with the phenol complex (carbon atoms colored in gray); water molecules which are not present when the ligand is bound are removed for clarity. In the complex the region from Gly191 to Asn195 is displaced relative to the apo-structure.
Figure 6
Figure 6
The variation of ligand enrichment (continuous lines) and decoy downgrading (broken lines) with protein dielectric constant when docking into: (a) the charged cavity of CCP W191G; (b) the hydrophobic cavity of T4 lysozyme L99A; (c) and(d) the slightly polar cavity of T4 lysozyme L99A/M102Q (for clarity, ligands and decoys are separated). For calculating the score, the dielectric constant in the pocket was varied from 1.84 to 10.19. The ligands and decoys are the corresponding “test set” compounds (see Methods) except for CCP W191G, where the test set was augmented with the newly-discovered docking hits (Table 2).
Figure 7
Figure 7
Ranks of the CCP W191G cavity ligands (test set ligands and the new ligands in Table 2) scored using Gaussian charges and desolvation energies plotted against the ranks obtained using AMSOL charges and desolvation energies.

References

    1. Kitchen DB, Decornez H, Furr JR, Bajorath J. Docking and scoring in virtual screening for drug discovery: methods and applications. Nature Rev Drug Discov. 2004;3:935–949. - PubMed
    1. Shoichet BK. Virtual screening of chemical libraries. Nature. 2004;432:862–865. - PMC - PubMed
    1. Alvarez JC. High-throughput docking as a source of novel drug leads. Curr Opin Chem Biol. 2004;8:365–370. - PubMed
    1. Abagyan R, Totrov M. High-throughput docking for lead generation. Curr Opin Chem Biol. 2001;5:375–382. - PubMed
    1. Huang D, Luthi U, Kolb P, Edler K, Cecchini M, Audetat S, et al. Discovery of cell-permeable non-peptide inhibitors of beta-secretase by high-throughput docking and continuum electrostatics calculations. J Med Chem. 2005;48:5108–5111. - PubMed

Publication types

LinkOut - more resources