. 2006 Apr;7(4):392-400.
doi: 10.1038/ni1311. Epub 2006 Feb 19.

Negative regulation of CD8 expression via Cd8 enhancer-mediated recruitment of the zinc finger protein MAZR

Affiliations

Negative regulation of CD8 expression via Cd8 enhancer-mediated recruitment of the zinc finger protein MAZR

Ivan Bilic et al. Nat Immunol. 2006 Apr.

Abstract

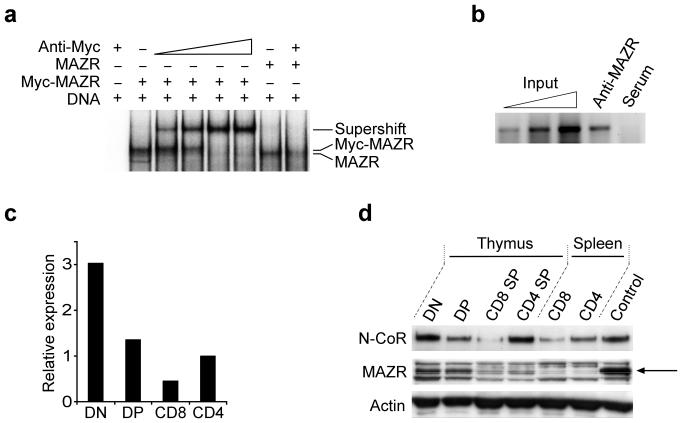
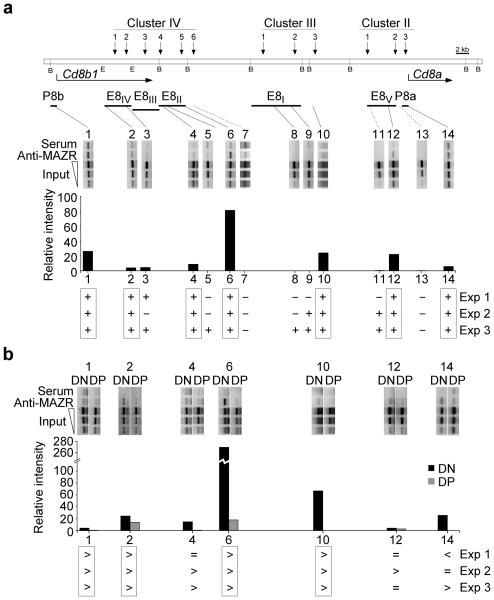
Coreceptor expression is tightly regulated during thymocyte development. Deletion of specific Cd8 enhancers leads to variegated expression of CD8alphabeta heterodimers in double-positive thymocytes. Here we show CD8 variegation is correlated with an epigenetic 'off' state, linking Cd8 enhancer function with chromatin remodeling of the adjacent genes Cd8a and Cd8b1 (Cd8). The zinc finger protein MAZR bound the Cd8 enhancer and interacted with the nuclear receptor corepressor N-CoR complex in double-negative thymocytes. MAZR was downregulated in double-positive and CD8 single-positive thymocytes. 'Enforced' expression of MAZR led to impaired Cd8 activation and variegated CD8 expression. Our results demonstrate epigenetic control of the Cd8 loci and identify MAZR as an important regulator of Cd8 expression.


Figures

Fig. 1
Fig. 1
Epigenetic changes at the Cd8a and Cd8b1 gene complex in E8I,E8II doubly deficient (Δ1Δ2/Δ1Δ2) thymocytes. (a) Flow cytometric analysis of CD4 and CD8 expression on thymocytes isolated from either +/Δ1Δ2 × Tcra−/− or Δ1Δ2/Δ1Δ2 × Tcra−/− mice as reported previously. The numbers in the quadrants indicate the percentage of the corresponding thymocyte subpopulations (of total gated thymocytes). Sorting areas for “CD8-negative” (CD8-neg) and bona fide DP thymocytes for ChIP (Fig. 1b) and DNA methylation (Fig. 2) assays are indicated by rectangles. Data are representative of more than 10 mice analyzed. (b) Top: Map of the Cd8 gene loci after the deletion of E8I and E8II. Horizontal arrows indicate the transcriptional orientation of the Cd8 genes. Vertical arrows indicate the localization of DH sites that constitute clusters II, III, and IV. The horizontal bars indicate genomic fragments used to define enhancers E8III, E8IV, and E8V as previously reported, and Cd8a (P8a) and Cd8b1 (P8b) promoter regions. The triangles represent loxP sites left after the deletion of E8I and E8II. Only relevant BamHI (B) and EcoRI (E) sites are shown. Bottom: PCR analysis of chromatin-immunoprecipitated DNA from sorted “CD8-negative” DP (−) and DP (+) thymocytes. Six amplicons denoted by the bars spanning the Cd8 gene cluster are shown. The Cd4 promoter region (P4) and the Gapdh locus were amplified as controls. Input DNA was used undiluted, or at 1:3 and 1:10 dilutions to ensure PCR quantification within a non-saturated amplification range. Relative abundance of histone H3 or H4 acetylation, and H3K4 trimethylation ((Me)3-H3K4) at the corresponding gene loci in CD8 expressing DP thymocytes were set to 1 (=100%). ChIP assays for AcH3 and AcH4 were repeated at least three times with three independent samples, while assays for (Me)3H3K4 were repeated twice.
Fig. 2
Fig. 2
DNA methylation of the promoter, exon, and intron regions of the Cd8a and Cd8b1 genes. Genomic DNA from DP and “CD8-negative” DP thymocytes was treated with sodium bisulfite and amplified by PCR as indicated by black thin lines (after ref. 23,24). Positions are indicated relative to the initation codon. Individual PCR products were cloned and sequenced, each line representing one clone. Four clones of each of three independently prepared thymocytes for each group were sequenced. Unmethylated CpG sites are indicated by open circles, whereas methylated CpG sites are indicated by filled circles.
Fig. 3
Fig. 3
Enhancer E8II binding properties and expression pattern of MAZR. (a) Electrophoretic mobility shift assay (EMSA) showing in vitro binding of MAZR or Myc-MAZR to E8II RE-1 (Supplementary Fig. 2b online). Open wedge indicates addition of increasing amounts of anti-Myc. Data are representative of two independent experiments. (b) Chromatin immunoprecipitation (ChIP) assay showing in vivo interaction of MAZR with RE-1 in DN thymocytes. Primer pairs used for PCR correspond to amplicon 6 (Supplementary Table 2 online). Input DNA was used undiluted, or at 1:3 and 1:10 dilutions. Data are representative of seven independent experiments (c) Real-time qPCR quantification of MAZR expression in various thymocyte subsets. MAZR (Zfp278) transcript abundance was normalized to that of Hprt1 transcripts. (d) Immunoblot analysis showing MAZR and N-CoR expression levels in sorted thymocyte subpopulations and peripheral splenic CD8+ and CD4+ T cells. Whole cell lysates from 3 × 10⁶ cells were used for each population. Control, protein lysate generated from thymocytes that were transduced with MAZR retrovirus (see Methods). The arrow indicates the position of MAZR. Actin protein abundance was used to confirm equal loading. Data in c and d are representative of two independent experiments.
Fig. 4
Fig. 4
Forced expression of MAZR in thymocytes induces variegation of CD8 expression. (a) Two-color flow cytometry of MAZR transduced wild-type thymocytes. Representative dot plots show CD4 versus CD8 expression. Numbers in the dot plot quadrants indicate the percentage of the corresponding thymocyte subpopulations of total gated GFP (top) and GFP+ thymocytes (bottom), respectively. (b) Expression of CD3 and CD5 on CD4 SP (left), DP (middle) and CD8 SP (right) thymocytes (as defined by the gates in Fig. 4a). Top, expression of CD3 (left) and CD5 (right) in MIG-R-transduced thymocytes. Bottom, expression of CD3 (left) and CD5 (right) in MAZR-transduced thymocytes. Expression patterns for GFP+ and GFP populations are indicated. Numbers in the CD4 SP-gated histograms indicate the percentage of cells within the indicated regions (i.e. CD3lo and CD5int, respectively) of total gated thymocytes. Data are representative of at least 5 experiments.
Fig. 5
Fig. 5
MAZR-induced variegation in wild-type, E8I- and E8II-deficient thymocytes (a) Representative GFP expression profile of thymocytes transduced with MIG-R and MAZR. Gating areas for GFP (−) and GFP+ (+) cells (thin line rectangles), and high (hi) GFP-expressing cells (thick line rectangles) are shown. Scatter plots show the percentage of CD3lo (top) and CD5int (bottom) cells within the CD4 SP subset of MIG-R and MAZR transduced wild-type (wt; left), E8I-deficient (Δ1/Δ1; middle) or E8II-deficient (Δ2/Δ2; right) thymocytes, respectively. Each circle represents one mouse. Horizontal bars indicate average value. (b) Left, representative histograms of GFP+ thymocytes indicating gating areas for CD4+CD8-CD3lo, CD4+CD8-CD3hi and DP thymocytes, respectively, that were used to determine expression as shown in the right panel. Right, expression of the zinc finger transcription factor Th-POK in MAZR-trasnduced thymocytes. Semi-quantitative RT-PCR of Zbtb7b (Th-POK) mRNA levels in CD4+CD3lo, DP, and CD4+CD3hi populations of MAZR-transduced E8I-deficient thymocytes. Open wedges indicate undiluted sample, 1:3, and 1:10 dilutions, respectively. M, marker; −, RT(−) control. Hprt1 mRNA was used as quantification control.
Fig. 6
Fig. 6
MAZR is recruited to multiple sites within the Cd8a and Cd8b1 gene complex. (a) Top, schematic map of the Cd8a and Cd8b1 gene complex. Horizontal arrows indicate the transcriptional orientation of the Cd8a and Cd8b1 genes. Vertical arrows indicate the localization of DH sites that constitute clusters II, III, and IV. The horizontal thick bars below DH sites indicate genomic fragments used to define enhancers E8I, E8II, E8III, E8IV, and E8V as previously reported, and Cd8a (P8a) and Cd8b1 (P8b) promoter regions. All BamHI (B) but only relevant EcoRI (E) sites are shown. Middle, PCR analysis of chromatin-immunoprecipitated DNA from sorted primary DN thymocytes. 14 amplicons spanning the Cd8 gene cluster are shown. Solid lines indicate PCR amplicons containing potential MAZR binding sites (1, 2, 3, 4, 5, 6, 8, 9, 10, 12 and 14), while dotted lines indicate control PCR amplicons (7, 11 and 13) within or outside of known enhancers that contain no potential MAZR binding sites. (b) Top, PCR analysis of chromatin-immunoprecipitated DNA from sorted primary DN and DP thymocytes. The 7 PCR amplicons (1, 2, 4, 6, 10, 12 and 14) showing MAZR binding in DN thymocytes (Fig. 6a) are shown. The input DNA in a and b was used undiluted, or at 1:3 and 1:10 dilutions to ensure PCR quantification within a non-saturated amplification range. Signal intensities at 1:3 input dilutions were used to calculate relative signal intensities for each amplicon. One representative out of three independent experiments is shown (Experiment 1 for a and experiment 3 for b). The relative densitometric quantification values (arbitrary units) of PCR signal intensities of precipitated DNA relative to the input fraction for each amplicon were calculated as described in the Methods section. The summary for three independent experiments is shown below. Boxed amplicons indicate results observed in all three ChIP experiments. (a) + : indicates binding; − : no binding. (b) > : indicates more MAZR binding in DN cells; < : less MAZR binding in DN cells; = : equal MAZR binding in DN and DP cells.
Fig. 7
Fig. 7
BTB domain-dependent interaction of MAZR and N-CoR. (a) HEK293T cells overexpressing N-CoR and either MAZRmut (lane 1) or MAZR (lane 2) were lysed and N-CoR was immunoprecipitated using anti-N-CoR. Immunoblots were performed using either anti-MAZR serum or anti-N-CoR. Input shows anti-MAZR immunoblot on total cell lysates. (b) Lysates of 107 sorted DN thymocytes (lane 1), 107 total thymocytes (lane 2 and 3) were immunoprecipitated with anti-N-CoR (lanes 1 and 2). For mock IP (lane 3) thymocyte extracts were incubated with protein G beads only. Immunoblots were performed using either anti-MAZR serum or anti-N-CoR. Immunprecipitation data shown with DN and total thymocyte populations are representative of three independent experiments each.
Fig. 8
Fig. 8
The BTB domain alone is not sufficient to induce variegated expression of CD8 in DP thymocytes. Scatter plot showing percentage of CD3lo cells within GFP, GFP+, and GFPhi CD4 SP thymocytes of MIG-R, BTBMAZR, and MAZRΔZF transduced wild-type thymocytes. Representative gating areas for GFP expression are as in Fig. 5a. Each circle represents one mouse. Horizontal bars indicate average value.

References

    1. Fisher AG. Cellular identity and lineage choice. Nat Rev Immunol. 2002;2:977–982. - PubMed
    1. Ansel KM, Lee DU, Rao A. An epigenetic view of helper T cell differentiation. Nat Immunol. 2003;4:616–623. - PubMed
    1. Smale ST. The establishment and maintenance of lymphocyte identity through gene silencing. Nat Immunol. 2003;4:607–615. - PubMed
    1. Taniuchi I, Ellmeier W, Littman DR. The CD4/CD8 lineage choice: new insights into epigenetic regulation during T cell development. Adv Immunol. 2004;83:55–89. - PubMed
    1. Sawada S, Littman DR. Identification and characterization of a T-cell-specific enhancer adjacent to the murine Cd4 gene. Mol Cell Biol. 1991;11:5506–5515. - PMC - PubMed

Publication types

MeSH terms