

Insertion and assembly of membrane proteins via simulation
- PMID: 16492056
- PMCID: PMC4618310
- DOI: 10.1021/ja0569104
Insertion and assembly of membrane proteins via simulation
Abstract
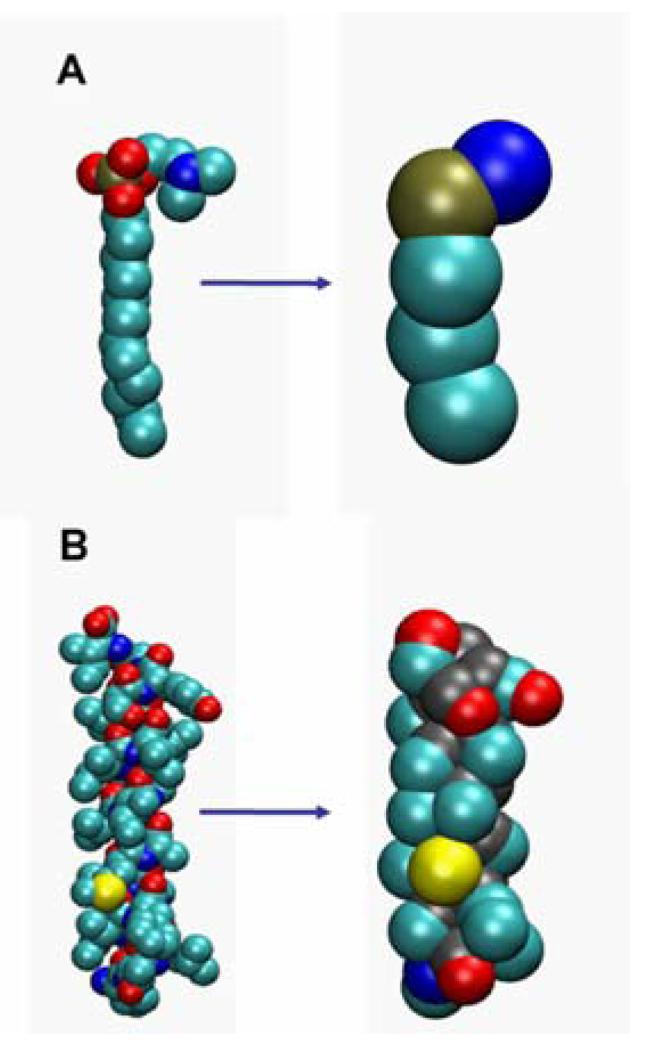
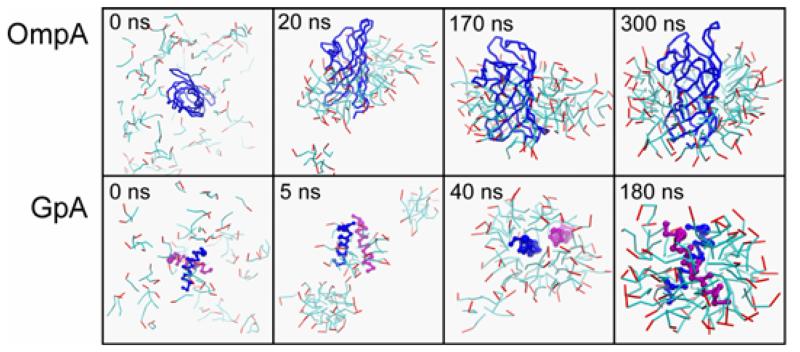
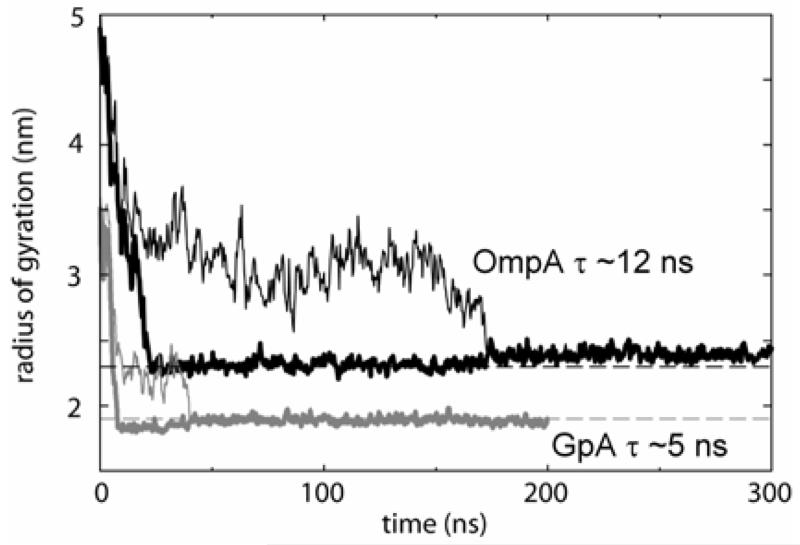
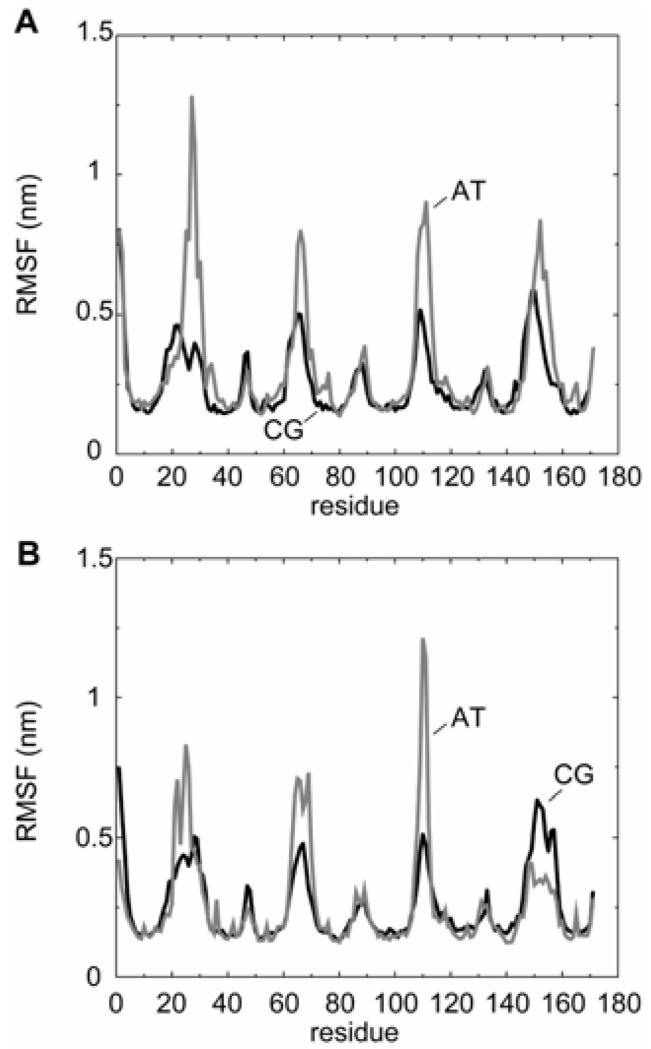
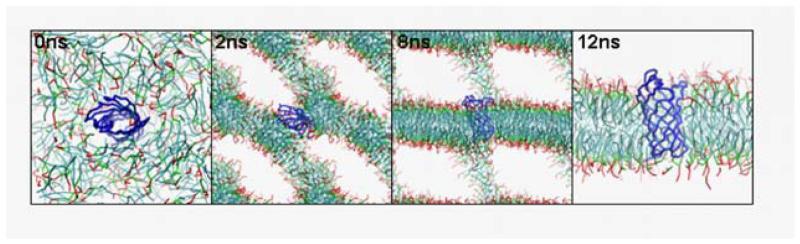
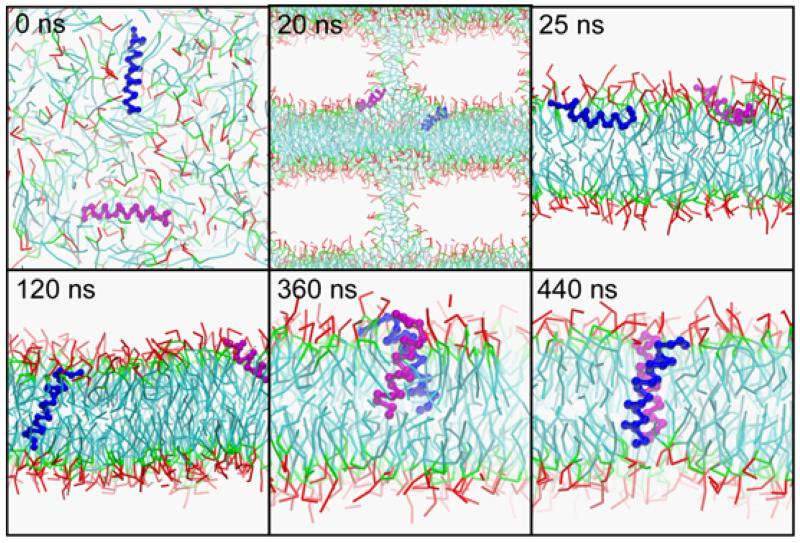
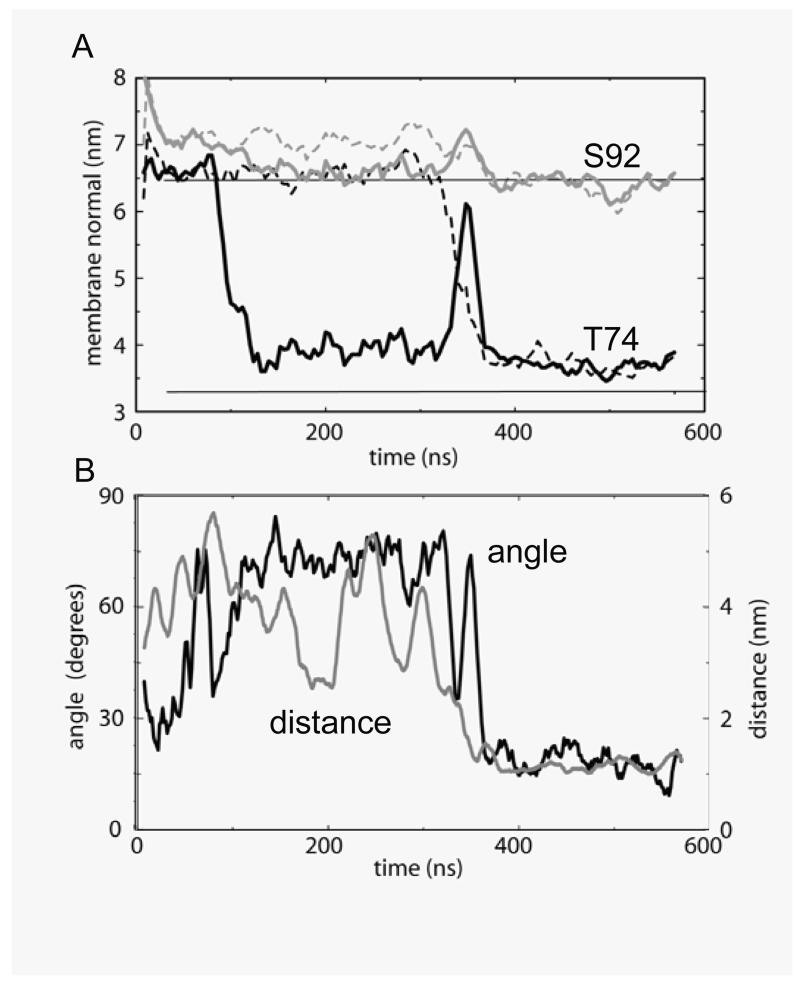
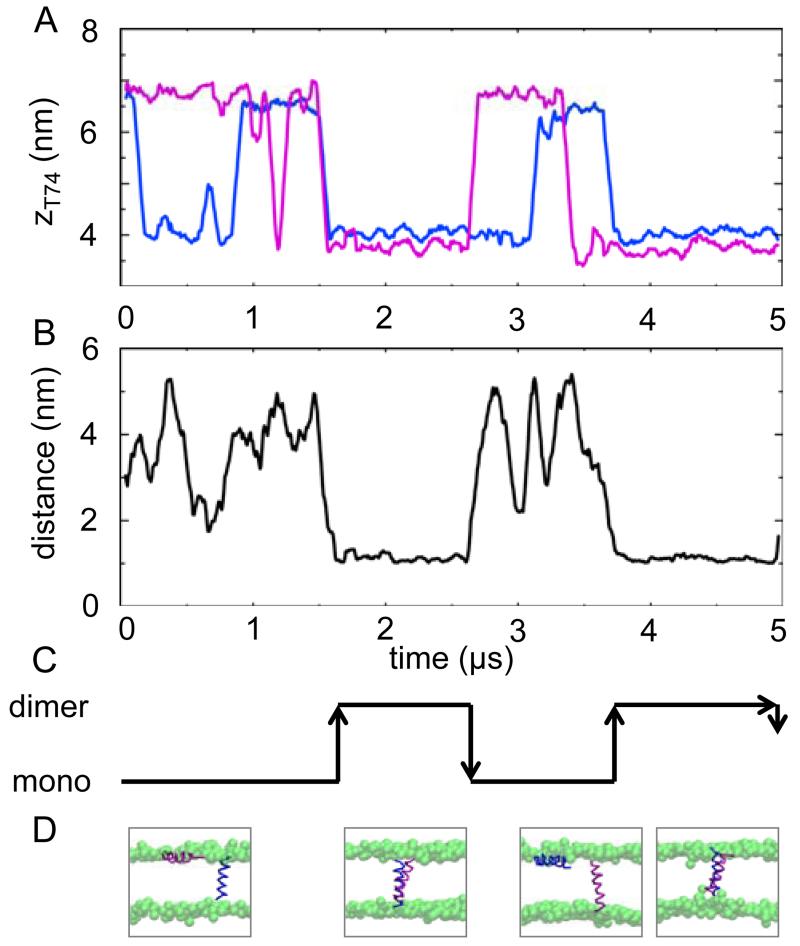
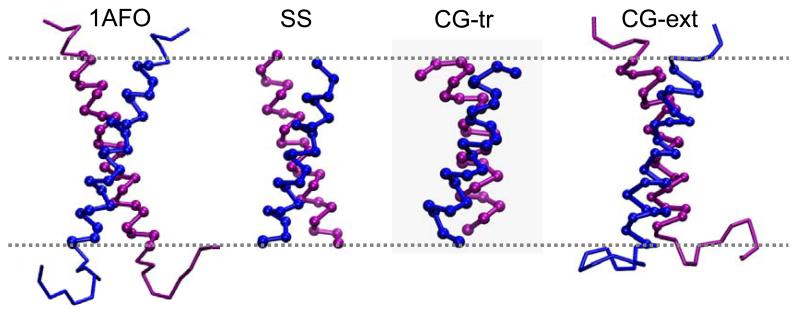
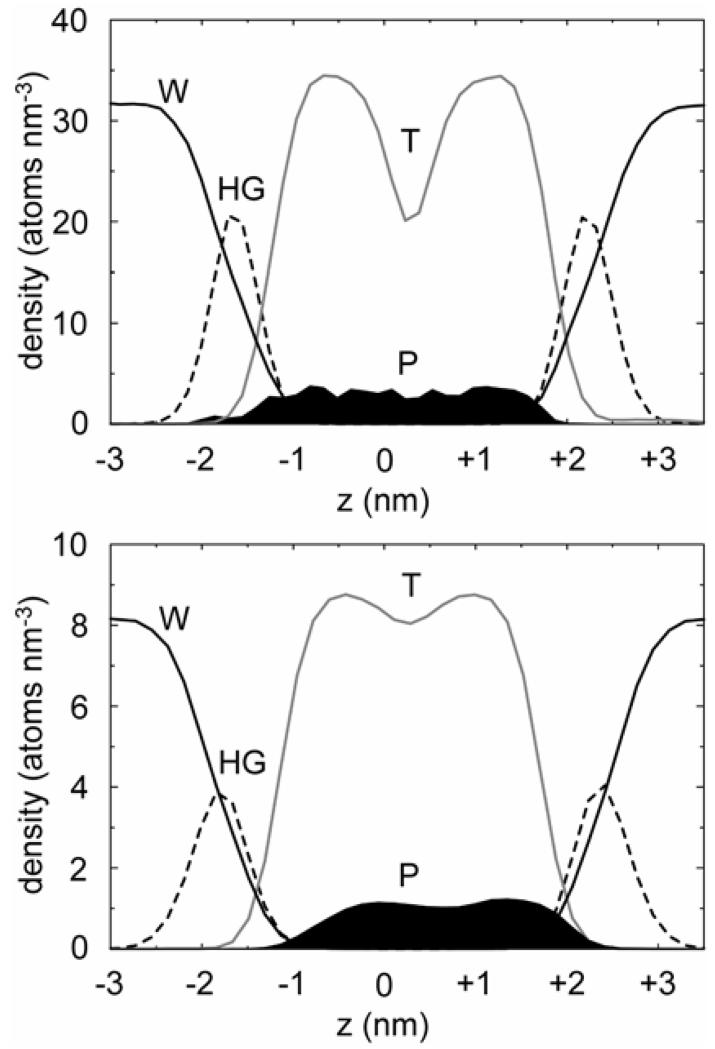
Interactions of lipids are central to the folding and stability of membrane proteins. Coarse-grained molecular dynamics simulations have been used to reveal the mechanisms of self-assembly of protein/membrane and protein/detergent complexes for representatives of two classes of membrane protein, namely, glycophorin (a simple alpha-helical bundle) and OmpA (a beta-barrel). The accuracy of the coarse-grained simulations is established via comparison with the equivalent atomistic simulations of self-assembly of protein/detergent micelles. The simulation of OmpA/bilayer self-assembly reveals how a folded outer membrane protein can be inserted in a bilayer. The glycophorin/bilayer simulation supports the two-state model of membrane folding, in which transmembrane helix insertion precedes dimer self-assembly within a bilayer. The simulations also suggest that a dynamic equilibrium exists between the glycophorin helix monomer and dimer within a bilayer. The simulated glycophorin helix dimer is remarkably close in structure to that revealed by NMR. Thus, coarse-grained methods may help to define mechanisms of membrane protein (re)folding and will prove suitable for simulation of larger scale dynamic rearrangements of biological membranes.
Figures
Similar articles
-
Molecular dynamics simulations of the dimerization of transmembrane alpha-helices.Acc Chem Res. 2010 Mar 16;43(3):388-96. doi: 10.1021/ar900211k. Acc Chem Res. 2010. PMID: 20017540
-
Transmembrane helix-helix interactions: comparative simulations of the glycophorin a dimer.Biochemistry. 2006 Dec 5;45(48):14298-310. doi: 10.1021/bi0610911. Biochemistry. 2006. PMID: 17128969
-
Correct folding of the beta-barrel of the human membrane protein VDAC requires a lipid bilayer.J Mol Biol. 2007 Apr 20;368(1):66-78. doi: 10.1016/j.jmb.2007.01.066. Epub 2007 Feb 3. J Mol Biol. 2007. PMID: 17336328
-
Membrane protein folding on the example of outer membrane protein A of Escherichia coli.Cell Mol Life Sci. 2003 Aug;60(8):1547-58. doi: 10.1007/s00018-003-3170-0. Cell Mol Life Sci. 2003. PMID: 14513830 Free PMC article. Review.
-
AMPs and OMPs: Is the folding and bilayer insertion of β-stranded outer membrane proteins governed by the same biophysical principles as for α-helical antimicrobial peptides?Biochim Biophys Acta. 2015 Sep;1848(9):1944-54. doi: 10.1016/j.bbamem.2015.02.019. Epub 2015 Feb 27. Biochim Biophys Acta. 2015. PMID: 25726906 Review.
Cited by
-
What lessons can be learned from studying the folding of homologous proteins?Methods. 2010 Sep;52(1):38-50. doi: 10.1016/j.ymeth.2010.06.003. Epub 2010 Jun 4. Methods. 2010. PMID: 20570731 Free PMC article. Review.
-
Stability and dynamics of membrane-spanning DNA nanopores.Nat Commun. 2017 Mar 20;8:14784. doi: 10.1038/ncomms14784. Nat Commun. 2017. PMID: 28317903 Free PMC article.
-
Using two fluorescent probes to dissect the binding, insertion, and dimerization kinetics of a model membrane peptide.J Am Chem Soc. 2009 Mar 25;131(11):3816-7. doi: 10.1021/ja809007f. J Am Chem Soc. 2009. PMID: 19256494 Free PMC article.
-
Peptide nanopores and lipid bilayers: interactions by coarse-grained molecular-dynamics simulations.Biophys J. 2009 May 6;96(9):3519-28. doi: 10.1016/j.bpj.2009.01.046. Biophys J. 2009. PMID: 19413958 Free PMC article.
-
Dimerization of the EphA1 receptor tyrosine kinase transmembrane domain: Insights into the mechanism of receptor activation.Biochemistry. 2014 Oct 28;53(42):6641-52. doi: 10.1021/bi500800x. Epub 2014 Oct 17. Biochemistry. 2014. PMID: 25286141 Free PMC article.
References
Publication types
MeSH terms
Substances
Grants and funding
LinkOut - more resources
Full Text Sources
