Memory T and memory B cells share a transcriptional program of self-renewal with long-term hematopoietic stem cells
- PMID: 16492737
- PMCID: PMC1413911
- DOI: 10.1073/pnas.0511137103
Memory T and memory B cells share a transcriptional program of self-renewal with long-term hematopoietic stem cells
Abstract
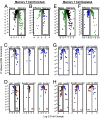
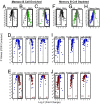
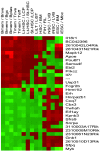
The only cells of the hematopoietic system that undergo self-renewal for the lifetime of the organism are long-term hematopoietic stem cells and memory T and B cells. To determine whether there is a shared transcriptional program among these self-renewing populations, we first compared the gene-expression profiles of naïve, effector and memory CD8(+) T cells with those of long-term hematopoietic stem cells, short-term hematopoietic stem cells, and lineage-committed progenitors. Transcripts augmented in memory CD8(+) T cells relative to naïve and effector T cells were selectively enriched in long-term hematopoietic stem cells and were progressively lost in their short-term and lineage-committed counterparts. Furthermore, transcripts selectively decreased in memory CD8(+) T cells were selectively down-regulated in long-term hematopoietic stem cells and progressively increased with differentiation. To confirm that this pattern was a general property of immunologic memory, we turned to independently generated gene expression profiles of memory, naïve, germinal center, and plasma B cells. Once again, memory-enriched and -depleted transcripts were also appropriately augmented and diminished in long-term hematopoietic stem cells, and their expression correlated with progressive loss of self-renewal function. Thus, there appears to be a common signature of both up- and down-regulated transcripts shared between memory T cells, memory B cells, and long-term hematopoietic stem cells. This signature was not consistently enriched in neural or embryonic stem cell populations and, therefore, appears to be restricted to the hematopoeitic system. These observations provide evidence that the shared phenotype of self-renewal in the hematopoietic system is linked at the molecular level.
Conflict of interest statement
Conflict of interest statement: No conflicts declared.
Figures


Similar articles
-
Identification of an evolutionarily conserved transcriptional signature of CD8 memory differentiation that is shared by T and B cells.J Immunol. 2008 Aug 1;181(3):1859-68. doi: 10.4049/jimmunol.181.3.1859. J Immunol. 2008. PMID: 18641323 Free PMC article.
-
Stemness of T cells and the hematopoietic stem cells: fate, memory, niche, cytokines.Cytokine Growth Factor Rev. 2013 Dec;24(6):485-501. doi: 10.1016/j.cytogfr.2013.10.002. Epub 2013 Oct 27. Cytokine Growth Factor Rev. 2013. PMID: 24231048 Free PMC article. Review.
-
Gene expression analysis of purified hematopoietic stem cells and committed progenitors.Blood. 2003 Jul 1;102(1):94-101. doi: 10.1182/blood-2002-08-2509. Epub 2003 Mar 6. Blood. 2003. PMID: 12623852
-
T and B lymphocyte differentiation from hematopoietic stem cell.Semin Immunol. 2008 Aug;20(4):207-12. doi: 10.1016/j.smim.2008.05.002. Epub 2008 Jun 25. Semin Immunol. 2008. PMID: 18583148 Free PMC article. Review.
-
Memory B cells and germinal centres.Res Immunol. 1991 Mar-Apr;142(3):268-72. doi: 10.1016/0923-2494(91)90074-s. Res Immunol. 1991. PMID: 1896620 Review. No abstract available.
Cited by
-
Heterologous immunity induced by 1st generation COVID-19 vaccines and its role in developing a pan-coronavirus vaccine.Front Immunol. 2022 Aug 15;13:952229. doi: 10.3389/fimmu.2022.952229. eCollection 2022. Front Immunol. 2022. PMID: 36045689 Free PMC article. Review.
-
Strong homeostatic TCR signals induce formation of self-tolerant virtual memory CD8 T cells.EMBO J. 2018 Jul 13;37(14):e98518. doi: 10.15252/embj.201798518. Epub 2018 May 11. EMBO J. 2018. PMID: 29752423 Free PMC article.
-
An IFN-gamma-IL-18 signaling loop accelerates memory CD8+ T cell proliferation.PLoS One. 2008 Jun 11;3(6):e2404. doi: 10.1371/journal.pone.0002404. PLoS One. 2008. PMID: 18545704 Free PMC article.
-
Mndal, a new interferon-inducible family member, is highly polymorphic, suppresses cell growth, and may modify plasmacytoma susceptibility.Blood. 2009 Oct 1;114(14):2952-60. doi: 10.1182/blood-2009-01-198812. Epub 2009 Aug 4. Blood. 2009. PMID: 19654412 Free PMC article.
-
Systematic comparison of gene expression between murine memory and naive B cells demonstrates that memory B cells have unique signaling capabilities.J Immunol. 2008 Jul 1;181(1):27-38. doi: 10.4049/jimmunol.181.1.27. J Immunol. 2008. PMID: 18566367 Free PMC article.
References
-
- Fearon D. T., Manders P., Wagner S. D. Science. 2001;293:248–250. - PubMed
-
- Kaech S. M., Wherry E. J., Ahmed R. Nat. Rev. Immunol. 2002;2:251–262. - PubMed
-
- Lanzavecchia A., Sallusto F. Nat. Rev. Immunol. 2002;2:982–987. - PubMed
-
- Kondo M., Wagers A. J., Manz M. G., Prohaska S. S., Scherer D. C., Beilhack G. F., Shizuru J. A., Weissman I. L. Annu. Rev. Immunol. 2002:759–806. - PubMed
-
- Schluns K. S., Lefrancois L. Nat. Rev. Immunol. 2003;3:269–279. - PubMed
Publication types
MeSH terms
Grants and funding
- T32 HL0762-18/HL/NHLBI NIH HHS/United States
- K08 AI063386/AI/NIAID NIH HHS/United States
- P01 DK053074/DK/NIDDK NIH HHS/United States
- 2 P30 DK36836-17/DK/NIDDK NIH HHS/United States
- P01DK053074/DK/NIDDK NIH HHS/United States
- R01HL058770/HL/NHLBI NIH HHS/United States
- R37 AI051530/AI/NIAID NIH HHS/United States
- T32 DK007260/DK/NIDDK NIH HHS/United States
- P30 DK036836/DK/NIDDK NIH HHS/United States
- 5 T32 DK007260-24/DK/NIDDK NIH HHS/United States
- R01 AI051530/AI/NIAID NIH HHS/United States
- R01AI047457/AI/NIAID NIH HHS/United States
- R01 AI047457/AI/NIAID NIH HHS/United States
- AI51530-01/AI/NIAID NIH HHS/United States
- R01 HL058770/HL/NHLBI NIH HHS/United States
LinkOut - more resources
Full Text Sources
Other Literature Sources
Medical
Molecular Biology Databases
Research Materials

