. 2006 Feb 28;103(9):3410-5.
doi: 10.1073/pnas.0507313103. Epub 2006 Feb 21.

AMPA receptor downscaling at the onset of Alzheimer's disease pathology in double knockin mice

Affiliations

AMPA receptor downscaling at the onset of Alzheimer's disease pathology in double knockin mice

Eric H Chang et al. Proc Natl Acad Sci U S A. .

Abstract

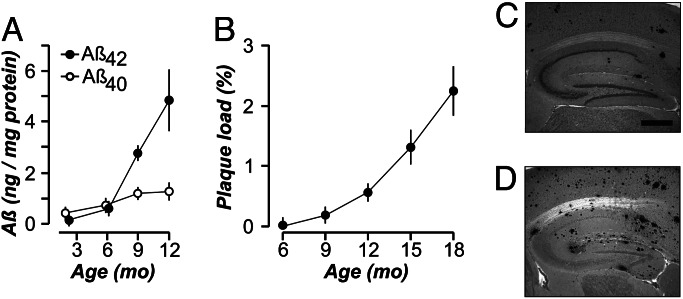
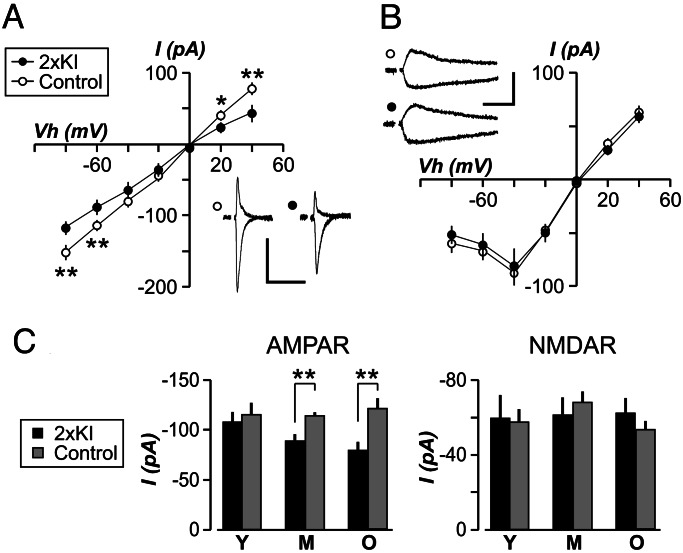
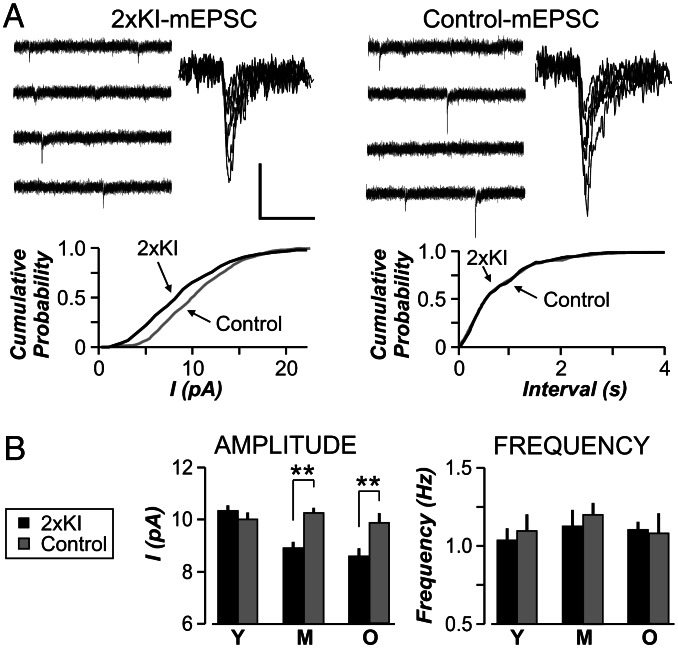
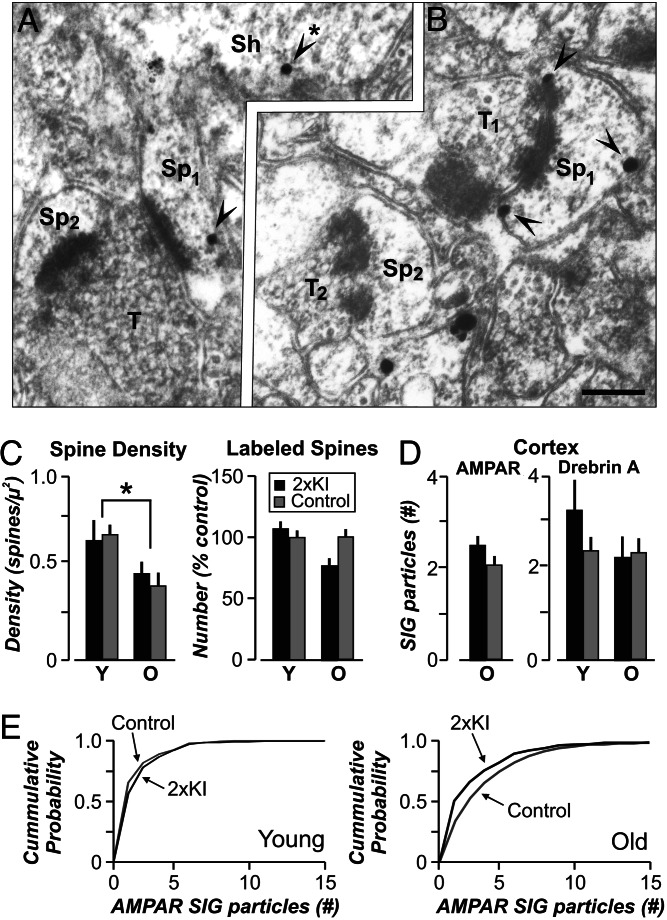
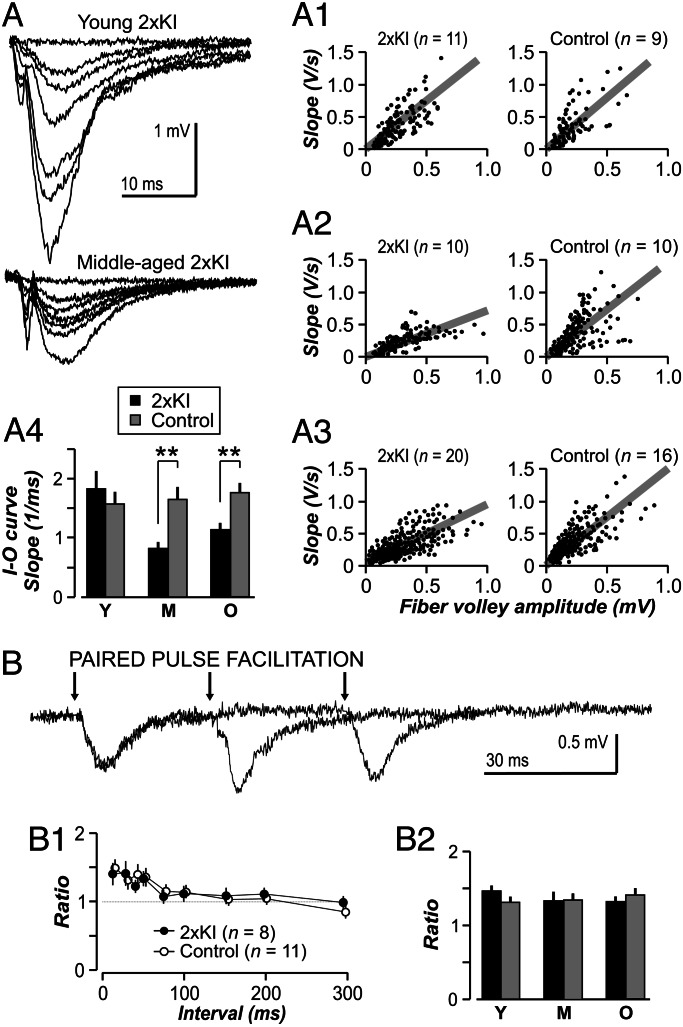
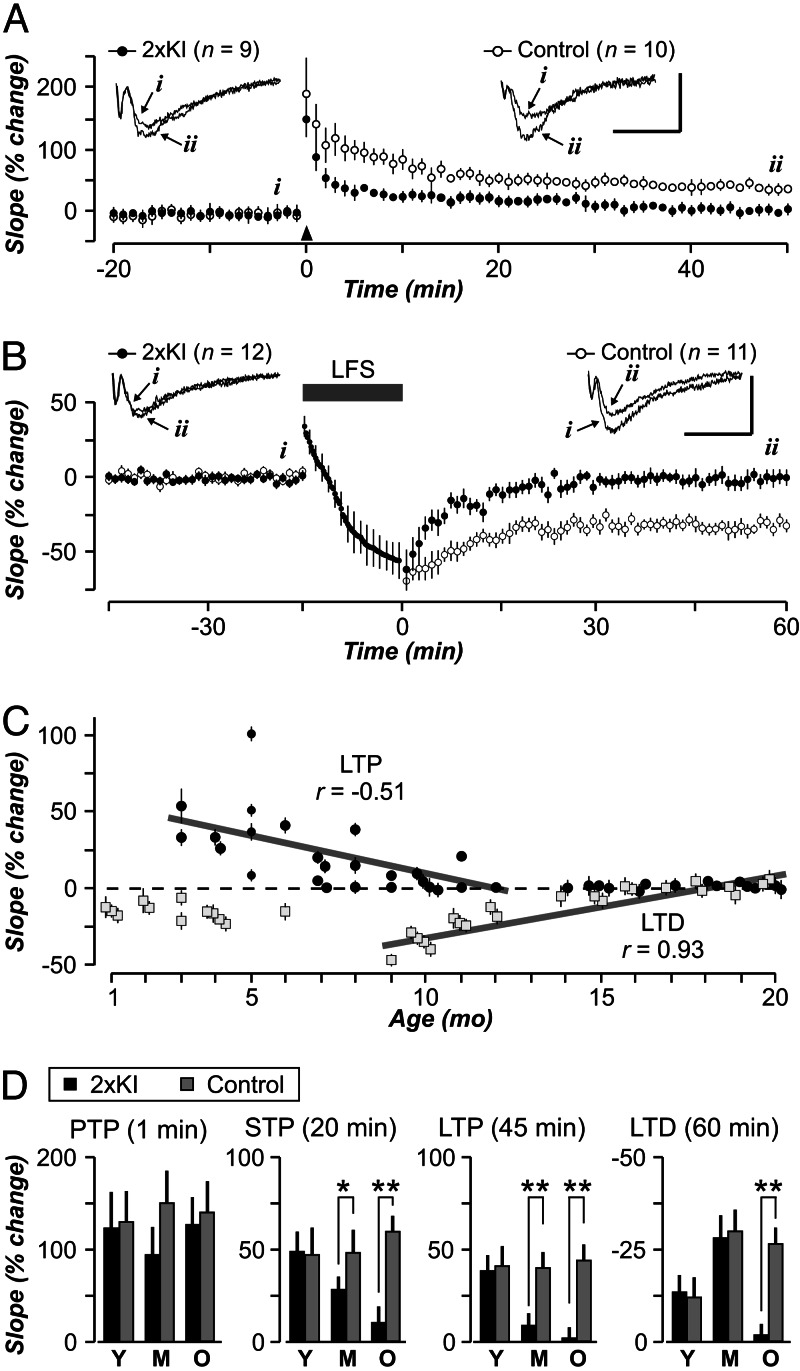
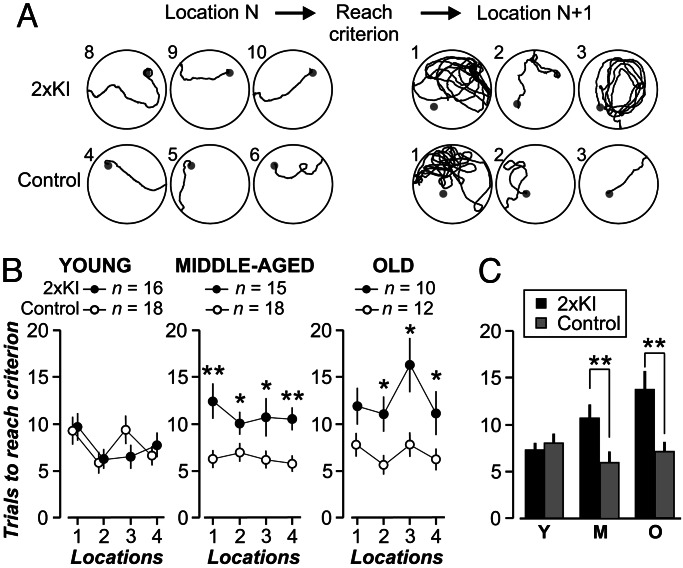
It is widely thought that Alzheimer's disease (AD) begins as a malfunction of synapses, eventually leading to cognitive impairment and dementia. Homeostatic synaptic scaling is a mechanism that could be crucial at the onset of AD but has not been examined experimentally. In this process, the synaptic strength of a neuron is modified so that the overall excitability of the cell is maintained. Here, we investigate whether synaptic scaling mediated by l-alpha-amino-3-hydroxy-5-methyl-4-isoxazolepropionic acid receptors (AMPARs) contributes to pathology in double knockin (2 x KI) mice carrying human mutations in the genes for amyloid precursor protein and presenilin-1. By using whole-cell recordings, we show that 2 x KI mice exhibit age-related downscaling of AMPAR-mediated evoked currents and spontaneous, miniature currents. Electron microscopic analysis further corroborates the synaptic AMPAR decrease. Additionally, 2 x KI mice show age-related deficits in bidirectional plasticity (long-term potentiation and long-term depression) and memory flexibility. These results suggest that AMPARs are important synaptic targets for AD and provide evidence that cognitive impairment may involve downscaling of postsynaptic AMPAR function.


Conflict of interest statement

Conflict of interest statement: No conflicts declared.

Figures

Fig. 1.
Fig. 1.
Aβ levels and plaque deposition. (A) Levels (mean ± SEM) of Aβ40 and Aβ42 in 2×KI mice (n = 3–10 per age). (B) Aβ plaque load (mean ± SD) increases linearly in the hippocampus (r = 0.961) of 2×KI mice (n = 3 per age). Representative sections of plaque load at 9 months (C) and 18 months (D). (Scale bar, 500 μm.)
Fig. 2.
Fig. 2.
Age-related decrease in evoked AMPAR currents in CA1 neurons of 2×KI mice. Current (I) to voltage relationships for AMPAR (A) and NMDAR (B), for middle-aged mice, show that AMPAR transmission is significantly decreased in 2×KI neurons at several holding voltages (Vh). (Insets) Sample EPSCs are shown at Vh of +40 mV and −80 mV. Calibration: 100 pA, 100 ms. (C) EPSC amplitudes (mean ± SEM), measured at Vh of −60 mV, are plotted for young (Y), middle-aged (M), and old (O) mice. AMPAR EPSCs are similar at young age but significantly diminished at other ages; n = 6–15 cells per group. ∗, P < 0.05; ∗∗, P < 0.005.
Fig. 3.
Fig. 3.
Amplitude of AMPAR mEPSCs is decreased in 2×KI mice across ages. (A Upper) Sample traces from middle-aged (10 months) 2×KI cell and a control cell. Each panel presents four 1-s traces (Left) and superimposed mEPSCs (Right). Calibration: for traces, 25 pA, 250 ms; for superimposed, 10 pA, 20 ms. (A Lower) Cumulative probability plots for 2×KI cells exhibit significantly smaller amplitude (Left; P < 0.001, Kolmogorov–Smirnov test) but similar frequency (Right; P > 0.1). (B) Amplitudes (mean ± SEM) are not altered at young (Y) age, but they are significantly decreased in middle-aged (M) and old (O) 2×KI cells (∗∗, P < 0.005). AMPAR mEPSC frequencies (mean ± SEM) are not different between 2×KI and control cells at any age (n = 6 cells per group).
Fig. 4.
Fig. 4.
The number of AMPAR is decreased in 2xKI hippocampal synapses across ages. Electron micrographs of AMPAR immunoreactivity in spines of CA1 cells, located in stratum radiatum, in 2×KI mice at 3 months (A) and 20 months (B). SIG-labeled AMPARs (arrowheads) are observed within spine heads (Sp) and dendritic shafts (Sh; arrowhead with ∗). T, axon terminal. (Scale bar, 200 nm.) A total area of 11,600 μm2 (673 EM fields) was quantified (2×KI: young, 4; old, 2; control: young, 2; old, 3 male mice). (C Left) Spine density (mean ± SEM) across all EM fields shows similar age-related decreases in spines of both groups (∗, P < 0.05). (C Right) The number of labeled spines is similar across genotypes and ages. Y, young mice; O, old mice. (D Left) AMPAR content in labeled cortical spines is similar across genotypes at the old age. (D Right) Drebrin A (mean ± SEM) shows a similar number of SIG particles in labeled cortical spines across genotypes and ages. (E) Cumulative probability plots for the AMPAR SIG particles in labeled CA1 spines, showing no differences in young mice (Left; P > 0.1, Kolmogorov–Smirnov test) but a significant reduction in older 2×KI mice (Right; P < 0.05, Kolmogorov–Smirnov test).
Fig. 5.
Fig. 5.
Age-related impairments in synaptic transmission in 2×KI mice. (A) Representative fEPSP traces for 2×KI mice. (A1–A3) Input–output (IO) functions measure basal transmission. Each circle represents a single input–output response. Gray lines are linear fits of the population for each age × genotype combination. There are no differences between genotypes at the young age (Y) (A1 and A4; P = 0.46, t test), but transmission is impaired in 2×KI mice at middle age (M) (A2 and A4) and old age (O) (A3 and A4; ∗∗, P < 0.005, t test). (B) PPF is not different between genotypes at any age. Representative fEPSP traces from a middle-aged 2×KI mouse showing PPF at interstimulus intervals of 30, 60, and 150 ms. Arrows indicate stimulation. (B1) Ratios for middle-aged slices show similar PPF at each interval; n indicates number of slices. (B2) PPF analysis at the 50-ms interval (mean ± SEM) reveals no age or genotype differences; n = 8–15 slices per group. P > 0.5 for all groups.
Fig. 6.
Fig. 6.
Age-related impairments in LTP and LTD in 2×KI mice. (A and B) Middle-aged control synapses display normal LTP (A) and LTD (B), whereas 2×KI synapses exhibit impaired bidirectional plasticity. Arrowhead in A marks the LTP-inducing tetanus. Gray bar in B marks the low-frequency stimulation (LFS) period. (Insets) Example fEPSP traces are taken from time points indicated by letters (i and ii); calibration: 1 mV, 10 ms; n indicates number of slices. (C) Age profile of LTP (solid circles) and LTD (gray squares) in 2×KI synapses. Both processes show nearly linear decreases across ages. The linear regression for LTP was done at ages 3–12 months and, for LTD, at ages 9–20 months. (D) Posttetanic potentiation (PTP) reveals no age or genotype differences, whereas short-term potentiation (STP) shows a gradual age-related decay in 2×KI synapses. LTP and LTD are similar among young (Y) genotypes, but LTP is completely absent in middle-aged (M) and old (O) 2×KI synapses. LTD is affected only in old 2×KI mice; n = 9–15 slices per group. ∗, P < 0.05; ∗∗, P < 0.005.
Fig. 7.
Fig. 7.
Age-related impairment of memory flexibility in 2×KI mice, assessed with the training-to-criterion task. (A) Diagrams depict swim paths by middle-aged 2×KI and control mice. Leftmost paths show mice reaching criterion (three consecutive trials in <20 s; trial number at left of each diagram). Rightmost paths show that the control mouse quickly switches its searching strategy, whereas the 2×KI mouse does not display this flexibility. (B) Graphs show trials to reach criterion by location, across ages; n indicates number of mice. (C) Analysis of locations 3 and 4 shows that 2×KI mice present age-related impairment, whereas control mice do not worsen with age. ∗, P < 0.05; ∗∗, P < 0.005.

Similar articles

Cited by

References

    1. Small D. H., Mok S. S., Bernstein J. C. Nat. Rev. Neurosci. 2001;2:595–598. - PubMed
    1. Selkoe D. J. Science. 2002;298:789–791. - PubMed
    1. Hardy J., Selkoe D. J. Science. 2002;297:353–356. - PubMed
    1. Rowan M. J., Klyubin I., Cullen W., Anwyl R. Philos. Trans. R. Soc. Lond. B. Biol. Sci. 2003;358:821–828. - PMC - PubMed
    1. Bliss T. V., Lomo T. J. Physiol. (London) 1973;232:331–356. - PMC - PubMed

Publication types

MeSH terms