. 2006 Feb 28;103(9):3381-6.
doi: 10.1073/pnas.0600134103. Epub 2006 Feb 21.

Amyloid-beta peptide binds with heme to form a peroxidase: relationship to the cytopathologies of Alzheimer's disease

Affiliations

Amyloid-beta peptide binds with heme to form a peroxidase: relationship to the cytopathologies of Alzheimer's disease

Hani Atamna et al. Proc Natl Acad Sci U S A. .

Abstract

Amyloid-beta peptide (Abeta) is the toxic agent in Alzheimer's disease (AD), although the mechanism causing the neurodegeneration is not known. We previously proposed a mechanism in which excessive Abeta binds to regulatory heme, triggering functional heme deficiency (HD), causing the key cytopathologies of AD. We demonstrated that HD triggers the release of oxidants (e.g., H(2)O(2)) from mitochondria due to the loss of complex IV, which contains heme-a. Now we add more evidence that Abeta binding to regulatory heme in vivo is the mechanism by which Abeta causes HD. Heme binds to Abeta, thus preventing Abeta aggregation by forming an Abeta-heme complex in a cell-free system. We suggest that this complex depletes regulatory heme, which would explain the increase in heme synthesis and iron uptake we observe in human neuroblastoma cells. The Abeta-heme complex is shown to be a peroxidase, which catalyzes the oxidation of serotonin and 3,4-dihydroxyphenylalanine by H(2)O(2). Curcumin, which lowers oxidative damage in the brain in a mouse model for AD, inhibits this peroxidase. The binding of Abeta to heme supports a unifying mechanism by which excessive Abeta induces HD, causes oxidative damage to macromolecules, and depletes specific neurotransmitters. The relevance of the binding of regulatory heme with excessive Abeta for mitochondrial dysfunction and neurotoxicity and other cytopathologies of AD is discussed.


Conflict of interest statement

Conflict of interest statement: No conflicts declared.

Figures
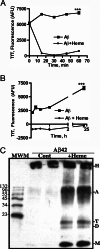
Fig. 1.
Fig. 1.
Heme dismantles Aβ aggregates and inhibits Aβ aggregation. Changes to the fluorescence of TfT were used to determine the level of Aβ aggregation as described in Materials and Methods. (A) The high fluorescence of TfT [expressed in arbitrary fluorescence units (AFU)] resulting from binding to Aβ aggregates declines upon incubation with heme. (B) The increase in the fluorescence of TfT resulting from spontaneous aggregation of freshly prepared Aβ monomers is depressed by heme. See text for an explanation for the negative fluorescence. Heme has no effect on the fluorescence of TfT in the absence of Aβ aggregates (data not shown). Data shown are means ± SD of triplicates of one representative example of four experiments. The last points of each curve are compared. ∗∗∗, P < 0.001. (C) Oligomers (A), tetramers (T), trimers (D), and monomers (M) of Aβ resulting from incubation with heme were determined at the end of the experiment in A by SDS/PAGE and Western blotting as described in Material and Methods. Controls (Cont) contain high-molecular-weight species (H) that did not enter the gel and a lack of monomeric forms of Aβ. Aβ oligomers, tetramers, trimers, and monomers appear by treatment with heme (+Heme). Duplicates are shown for each treatment. Shown is one representative example of four experiments.
Fig. 2.
Fig. 2.
The Aβ–heme complex is formed during the interaction of heme with Aβ. The spectrum of heme between 350 and 750 nm was measured at the end of the incubation in experiments identical to those described for Fig. 1 A and B. The red shift, an increase in the absorbance of the Soret band, and an increase in OD at 530 nm were always observed after heme binding to Aβ. Shown is one representative example of four experiments.
Fig. 3.
Fig. 3.
Peroxidase activity of the Aβ–heme complex. The oxidation of TMB by Aβ–heme peroxidase was followed by an increase in the absorbance of 652 nm. Aβ–heme, Aβ, heme, or PBS (Blank) was added to a 200-μl TMB-substrate kit specific for peroxidases (all tubes have H2O2). Aβ–heme was very efficient in the oxidation of TMB compared with heme. No oxidation of TMB by H2O2 occurs without heme in the absence (Blank) or presence of Aβ. The Aβ–heme complex was prepared as described in Materials and Methods. Shown is one representative example of five experiments.
Fig. 4.
Fig. 4.
Oxidation of serotonin by Aβ–heme and H2O2. An HPLC-UV detector set at 280 nm was used to measure the oxidation of serotonin catalyzed by Aβ–heme and H2O2 as described in Materials and Methods. The retention time of serotonin is 4.7 min, which was unchanged in the presence of H2O2. (Inset) Adding Aβ–heme to serotonin plus H2O2 decreases the serotonin peak after a 60-min reaction and leads to the formation of two oxidation products. The chromatogram shown is one representative example of five experiments.
Fig. 5.
Fig. 5.
Curcumin inhibits the peroxidase activity of Aβ–heme. The effect of curcumin (in 0.1 M NaOH) on Aβ–heme peroxidase activity was tested with TMB and H2O2 as described in Material and Methods. The addition of the 1–10 μl of curcumin solution did not affect the pH. The oxidation product of TMB was determined at 450 nm after acidification by sulfuric acid. Data shown are means ± SD (n = 3), which were compared with the control. ∗, P < 0.016 by unpaired t test; ∗∗∗, P < 0.0002 by unpaired t test.
Fig. 6.
Fig. 6.
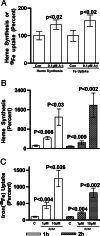
Aβ induces heme synthesis and iron uptake in human neuroblastoma (SHSY5Y) cells. Heme synthesis and 59Fe uptake by SHSY5Y cells were measured as described in Materials and Methods. Three concentrations of Aβ [0.1 μM (A), 1 μM (B), and 10 μM (C)] increased heme synthesis and iron uptake above the controls (mean ± SEM of the percent of the increase in heme or iron uptake). (A) Data are presented for only the 2-h incubations. (B) Heme synthesis in the control cells was 0.32 ± 0.1 and 0.84 ± 0.088 ng of heme per mg of protein after 1 and 2 h, respectively (mean ± SEM of six independent experiments, P < 0.006, nonparametric Mann–Whitney test). (C) Iron uptake was 2.44 ± 0.43 and 4.1 ± 0.46 ng of 59Fe per mg of protein after 1 and 2 h, respectively (mean ± SEM of six independent experiments, P < 0.03, nonparametric Mann–Whitney test).
Fig. 7.
Fig. 7.
Proposed consequences of excessive binding of heme with Aβ. Upon synthesis in the mitochondria (m), heme is exported to join the regulatory heme in the cytosol (step 1), where it serves in several metabolic activities (step 2). In AD brain, the production of Aβ increases (↑Aβ) from the processing of AβPP (step 3). Heme prevents Aβ aggregation (step 4). An excessive level of Aβ depletes the regulatory heme, creating HD and producing excess of Aβ–heme peroxidase (step 5), which contributes to oxidative stress in AD. Additional metabolic consequences are addressed in Discussion.

References

    1. Billings L. M., Oddo S., Green K. N., McGaugh J. L., Laferla F. M. Neuron. 2005;45:675–688. - PubMed
    1. Skovronsky D. M., Doms R. W., Lee V. M. J. Cell Biol. 1998;141:1031–1039. - PMC - PubMed
    1. Walsh D. M., Selkoe D. J. Protein Pept. Lett. 2004;11:213–228. - PubMed
    1. Smith M. A., Nunomura A., Zhu X., Takeda A., Perry G. Antioxid. Redox. Signal. 2000;2:413–420. - PubMed
    1. Parker W. D., Jr, Parks J., Filley C. M., Kleinschmidt-DeMasters B. K. Neurology. 1994;44:1090–1096. - PubMed

Publication types