

53BP1 and p53 synergize to suppress genomic instability and lymphomagenesis
- PMID: 16492765
- PMCID: PMC1413919
- DOI: 10.1073/pnas.0511259103
53BP1 and p53 synergize to suppress genomic instability and lymphomagenesis
Abstract
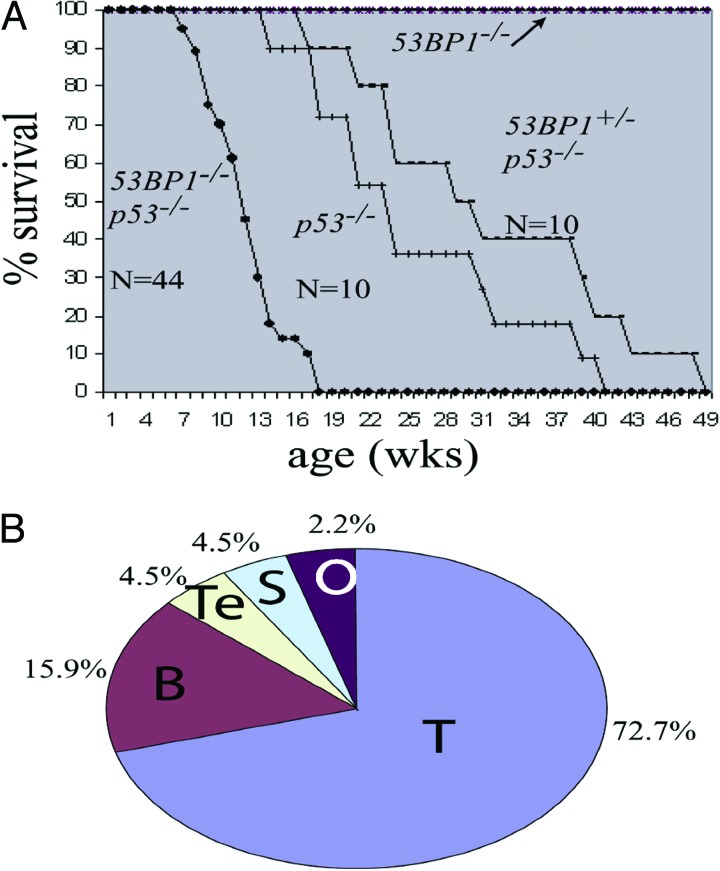
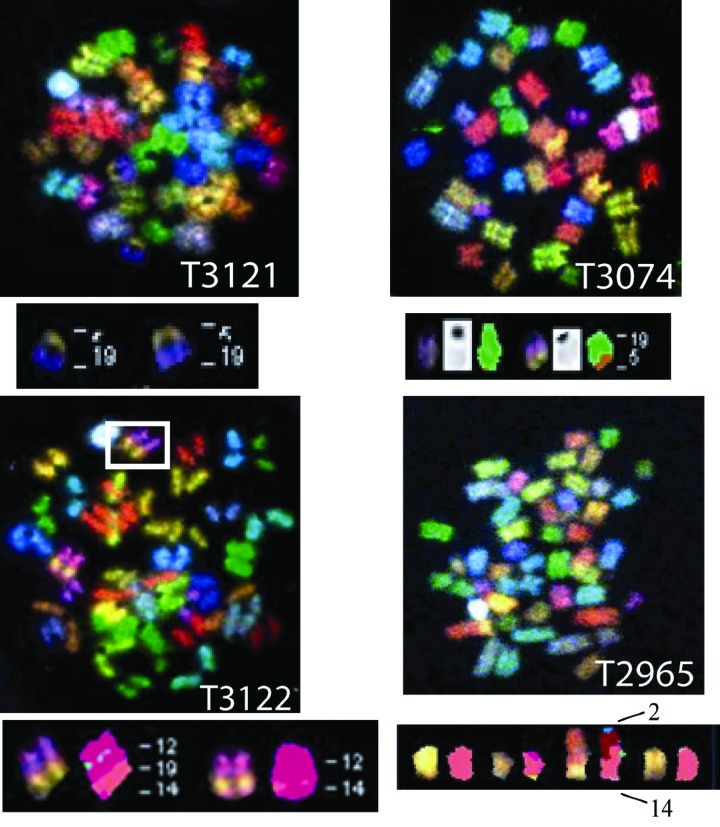
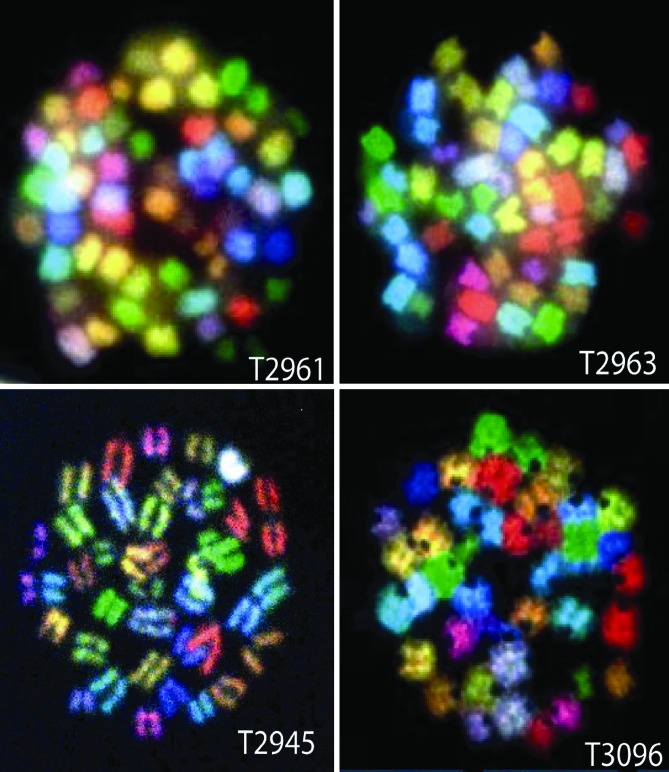
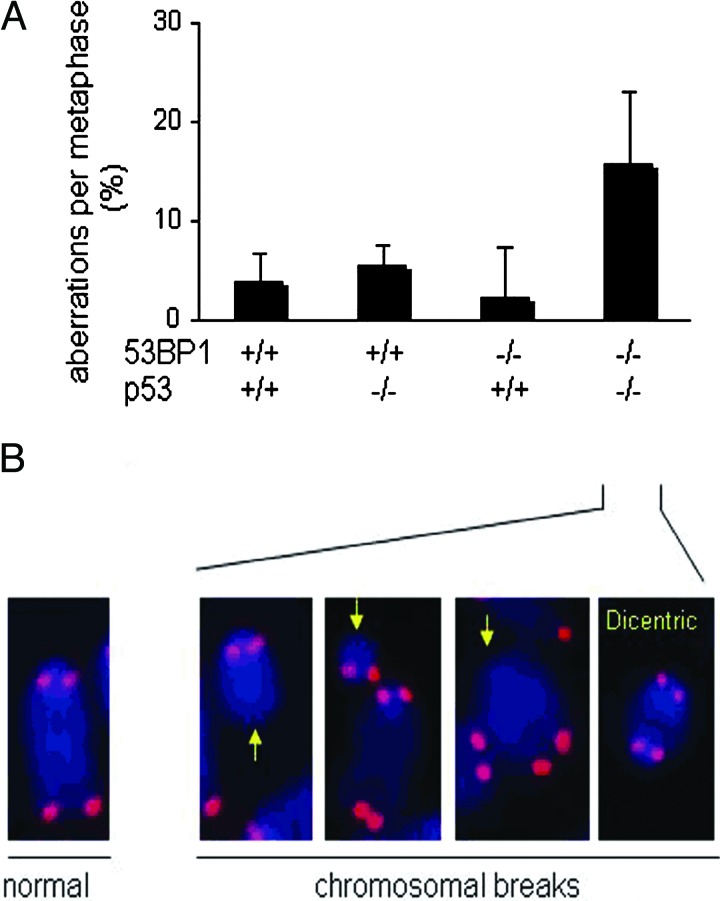
p53-binding protein 1 (53BP1) participates in the cellular response to DNA double-stranded breaks where it associates with various DNA repair/cell cycle factors including the H2AX histone variant. Mice deficient for 53BP1 (53BP1(-/-)) are sensitive to ionizing radiation and immunodeficient because of impaired Ig heavy chain class switch recombination. Here we show that, as compared with p53(-/-) mice, 53BP1(-/-)/p53(-/-) animals more rapidly develop tumors, including T cell lymphomas and, at lower frequency, B lineage lymphomas, sarcomas, and teratomas. In addition, T cells from animals deficient for both 53BP1 and p53 (53BP1(-/-)/p53(-/-)) display elevated levels of genomic instability relative to T cells deficient for either 53BP1 or p53 alone. In contrast to p53(-/-) T cell lymphomas, which routinely display aneuploidy but not translocations, 53BP1(-/-)/p53(-/-) thymic lymphomas fall into two distinct cytogenetic categories, with many harboring clonal translocations (40%) and the remainder showing aneuploidy (60%). We propose that 53BP1, in the context of p53 deficiency, suppresses T cell lymphomagenesis through its roles in both cell-cycle checkpoints and double-stranded break repair.
Conflict of interest statement
Conflict of interest statement: No conflicts declared.
Figures
Similar articles
-
Aberrant V(D)J recombination is not required for rapid development of H2ax/p53-deficient thymic lymphomas with clonal translocations.Blood. 2008 Feb 15;111(4):2163-9. doi: 10.1182/blood-2007-08-104760. Epub 2007 Sep 13. Blood. 2008. PMID: 17855626 Free PMC article.
-
53BP1 cooperates with p53 and functions as a haploinsufficient tumor suppressor in mice.Mol Cell Biol. 2005 Nov;25(22):10079-86. doi: 10.1128/MCB.25.22.10079-10086.2005. Mol Cell Biol. 2005. PMID: 16260621 Free PMC article.
-
PARP1 and DNA-PKcs synergize to suppress p53 mutation and telomere fusions during T-lineage lymphomagenesis.Oncogene. 2013 Apr 4;32(14):1761-71. doi: 10.1038/onc.2012.199. Epub 2012 May 21. Oncogene. 2013. PMID: 22614020 Free PMC article.
-
53BP1-mediated DNA double strand break repair: insert bad pun here.DNA Repair (Amst). 2011 Oct 10;10(10):1071-6. doi: 10.1016/j.dnarep.2011.07.012. Epub 2011 Aug 24. DNA Repair (Amst). 2011. PMID: 21868291 Review.
-
53BP1-mediated activation of the tumor suppressor p53.Curr Opin Cell Biol. 2024 Dec;91:102424. doi: 10.1016/j.ceb.2024.102424. Epub 2024 Sep 7. Curr Opin Cell Biol. 2024. PMID: 39244835 Review.
Cited by
-
Plk1-mediated stabilization of 53BP1 through USP7 regulates centrosome positioning to maintain bipolarity.Oncogene. 2017 Feb 16;36(7):966-978. doi: 10.1038/onc.2016.263. Epub 2016 Aug 1. Oncogene. 2017. PMID: 27477698
-
Pilot clinical trial and phenotypic analysis in chemotherapy-pretreated, metastatic triple-negative breast cancer patients treated with oral TAK-228 and TAK-117 (PIKTOR) to increase DNA damage repair deficiency followed by cisplatin and nab paclitaxel.Biomark Res. 2023 Jul 25;11(1):73. doi: 10.1186/s40364-023-00511-7. Biomark Res. 2023. PMID: 37491309 Free PMC article.
-
53BP1 loss induces chemoresistance of colorectal cancer cells to 5-fluorouracil by inhibiting the ATM-CHK2-P53 pathway.J Cancer Res Clin Oncol. 2017 Mar;143(3):419-431. doi: 10.1007/s00432-016-2302-5. Epub 2016 Nov 12. J Cancer Res Clin Oncol. 2017. PMID: 27838786 Free PMC article.
-
Functional overlaps between XLF and the ATM-dependent DNA double strand break response.DNA Repair (Amst). 2014 Apr;16:11-22. doi: 10.1016/j.dnarep.2014.01.010. Epub 2014 Feb 20. DNA Repair (Amst). 2014. PMID: 24674624 Free PMC article. Review.
-
The histone H2B-specific ubiquitin ligase RNF20/hBRE1 acts as a putative tumor suppressor through selective regulation of gene expression.Genes Dev. 2008 Oct 1;22(19):2664-76. doi: 10.1101/gad.1703008. Genes Dev. 2008. PMID: 18832071 Free PMC article.
References
Publication types
MeSH terms
Substances
Grants and funding
LinkOut - more resources
Full Text Sources
Medical
Molecular Biology Databases
Research Materials
Miscellaneous
