. 2006 Feb 28;103(9):3060-5.
doi: 10.1073/pnas.0511010103. Epub 2006 Feb 21.

Rhodopsin self-associates in asolectin liposomes

Affiliations

Rhodopsin self-associates in asolectin liposomes

Steven E Mansoor et al. Proc Natl Acad Sci U S A. .

Abstract

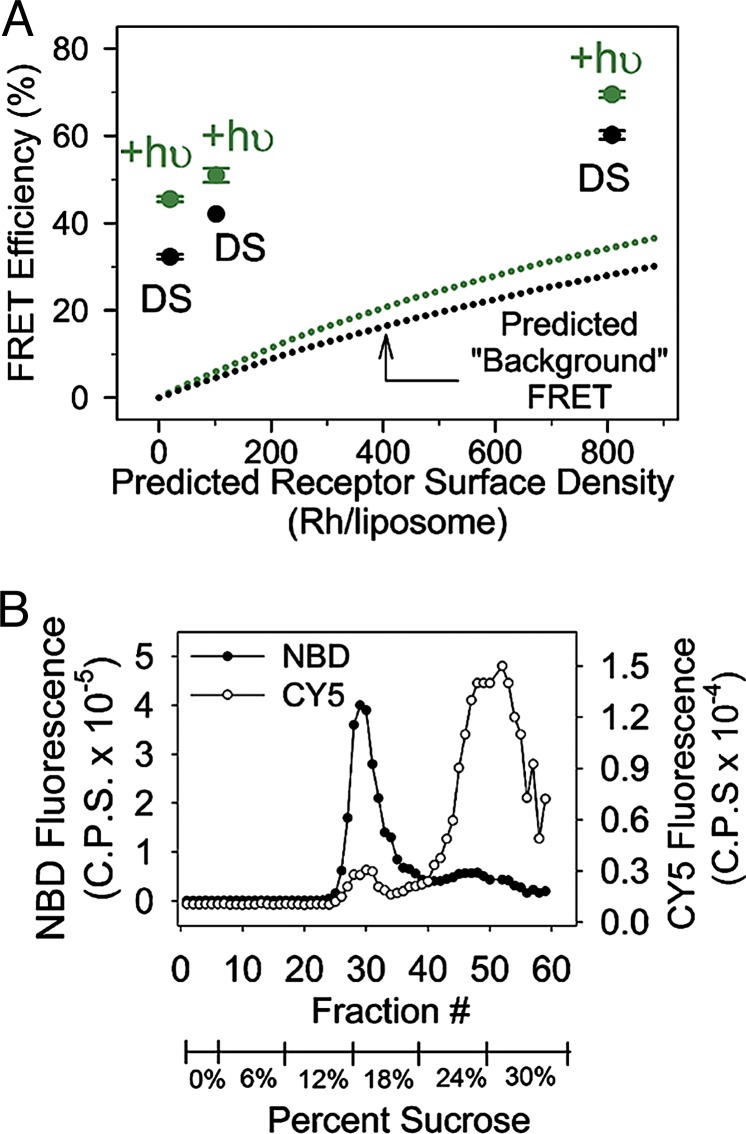
We show that the photoreceptor rhodopsin (Rh) can exist in the membrane as a dimer or multimer using luminescence resonance energy transfer and FRET methods. Our approach looked for interactions between Rh molecules reconstituted into asolectin liposomes. The low receptor density used in the measurements ensured minimal receptor crowding and artifactual association. The fluorescently labeled Rh molecules were fully functional, as measured by their ability to activate the G protein transducin. The luminescence resonance energy transfer measurements revealed a distance of 47-50 Angstroms between Rh molecules. The measured efficiency of FRET between receptors was close to the theoretical maximum possible, indicating nearly quantitative Rh-Rh association. Together, these results provide compelling evidence that Rh spontaneously self-associates in membranes.


Conflict of interest statement

Conflict of interest statement: No conflicts declared.

Figures

Fig. 1.
Fig. 1.
Preparation and functional characterization of labeled Rh samples. (A) SDS/PAGE analysis of V8 digested CY3-labeled Rh samples shows roughly equal distribution of labels on C140 and C316. (B) Electron microscopy reveals that asolectin liposomes reconstituted with Rh have an average radius of ≈75 nm. (C) Asp-N proteolysis indicates Rh–CY3 and Rh–CY5 are preferentially oriented inside-out in the liposomes. Because Asp-N cleaves Rh at the C terminus, a shift in protein mobility indicates the C terminus is located outside the liposome, and is accessible to the protease. (Upper) Imaging of CY3 fluorescence. (Lower) Coomassie stain. The individually labeled, reconstituted samples are indicated. Det. refers to a detergent solubilized control. The imaging instrument was not sensitive to CY5 fluorescence. (D) The fluorescent labels do not alter the ability of Rh, reconstituted into liposomes, to activate transducin (GαT). The initial activation rates were ≈ 1.3 pmol/min per pmol Rh for both the unlabeled (open circles) and labeled (open triangles), reconstituted Rh samples. The activation rates were determined by linear regression through the data points converging 3 min after addition of guanosine 5′-[γ-thio]triphosphate. The filled circles show the dark state control.
Fig. 2.
Fig. 2.
LRET measurements show labeled Rh samples are 47–50 Å apart. (A) Cartoon scheme of LRET experiments. Excited Rh–Tb (donor) will transfer energy to Rh–CY3 (acceptor), with an efficiency proportional to the distance between the two proteins (see Eqs. 4 and 5). (B) Spectral overlap of Rh–Tb and Rh–CY3. The LRET experiments involve exciting Rh–Tb at 337 nm and collecting the sensitized emission from Rh–CY3 at 570 nm. (C) LRET decay data obtained from a dark state mixture of Rh–Tb and Rh–CY3. Exciting the Rh–Tb results in a strong sensitized emission signal from Rh–CY3 (green decay curve), which decays with an average lifetime 〈τAD〉 ≈ 200 μs. The average lifetime of Rh–Tb alone yields a 〈τD〉 ≈ 870 μs (blue decay curve). (D) Predicted sensitized LRET lifetimes (τAD) as a function of distance between Rh–Tb and Rh–CY3. The plot indicates the ≈200-μs τAD measured above corresponds to a Rh–Tb to Rh–CY3 distance of ≈50 Å (red line). After light activation, the Rh–Rh distance decreased slightly to 47 Å (see Table 1).
Fig. 3.
Fig. 3.
FRET studies show strong Rh–Rh energy transfer in liposomes. (A) Cartoon scheme of FRET studies. Excitation of Rh–CY3 (donor) will transfer energy to Rh–CY5 (acceptor) with an efficiency proportional to the distance between them (see Eq. 5). (B) Spectral overlap of CY3 and CY5. The amount of overlap, J(λ), is indicated in dark gray and results in a calculated R0 for this FRET pair of 52 Å in the dark state and 56 Å after light activation of rhodopsin. (C) The arrows indicate the strong FRET observed between Rh–CY3 and Rh–CY5 when reconstituted together into asolectin liposomes (green curve). The control (red curve) shows no FRET signal for a summation of individually labeled and reconstituted Rh–CY3 and Rh–CY5 measured at identical concentrations and conditions. In this example, reconstitution used 10,000 moles of asolectin lipids per mole of Rh. Except for buffer subtraction, the data have not been manipulated or normalized in any way.
Fig. 4.
Fig. 4.
FRET signal as a function of receptor density. (A) Experimentally determined FRET efficiencies for Rh in the dark-state (DS), and after illumination (+hυ), at different predicted receptor densities (Rh/liposome). The FRET signals are well above the nonspecific or “background FRET” predicted to occur due to molecular crowding with increasing receptor density (dotted lines) (46). (B) Isopycnic centrifugation at the lowest receptor concentration (10,000× lipid/Rh). Open circles indicate the Rh–CY5 fluorescence, and filled circles indicate the NBD-labeled lipid fluorescence. The data indicate ≈90% of Rh incorporates into ≈11% of the total liposomes. Thus, Rh-containing vesicles have ≈200 Rh per liposome, yielding a predicted background FRET signal of ≈8% in the dark state and ≈11% after light activation (note that these values are still well below the measured FRET signals in A).
Fig. 5.
Fig. 5.
Rh samples show near quantitative self-association in liposomes. (A) Cartoon illustrating how only half of the mixed samples can form donor, D, and acceptor, A, FRET pairs. (B) Plot of energy transfer efficiency as a function of distance between the Rh–CY3 and Rh–CY5 pairs. The predicted FRET efficiency for Rh–CY3:Rh–CY5 is ≈56% at the ≈50 Å dark-state Rh–Rh distance measured by LRET. The maximum FRET for an equimolar mixture Rh–CY3 and Rh–CY5 in the dark-state is ≈28% (half of 56%). For light-activated Rh, the maximum possible FRET signal at the LRET distance of 47 Å is ≈ 37% (half of 74%). (C) The theoretical maximum and measured FRET efficiencies are nearly identical, indicating that essentially all of the Rh samples are close enough to participate in a dimeric (or other higher order) interaction. The theoretical maximum FRET efficiencies are shown in the blue bars, and the experimentally determined FRET efficiencies (corrected for the background FRET predicted in Fig. 4) are shown by the gray bars.

Similar articles

Cited by

References

    1. Zeng F. Y., Wess J. J. Biol. Chem. 1999;274:19487–19497. - PubMed
    1. Devi L. A. Trends Pharmacol. Sci. 2001;22:532–537. - PubMed
    1. Guo W., Shi L., Filizola M., Weinstein H., Javitch J. A. Proc. Natl. Acad. Sci. USA. 2005;102:17495–17500. - PMC - PubMed
    1. Ramsay D., Kellett E., McVey M., Rees S., Milligan G. Biochem. J. 2002;365:429–440. - PMC - PubMed
    1. Park P. S., Filipek S., Wells J. W., Palczewski K. Biochemistry. 2004;43:15643–15656. - PMC - PubMed

Publication types