

Myo1c binds tightly and specifically to phosphatidylinositol 4,5-bisphosphate and inositol 1,4,5-trisphosphate
- PMID: 16492791
- PMCID: PMC1413866
- DOI: 10.1073/pnas.0505685103
Myo1c binds tightly and specifically to phosphatidylinositol 4,5-bisphosphate and inositol 1,4,5-trisphosphate
Abstract
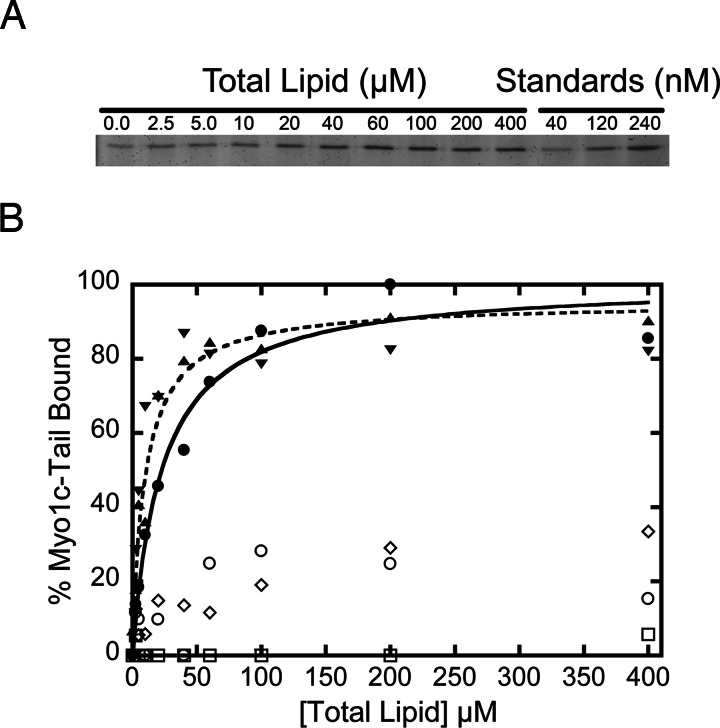
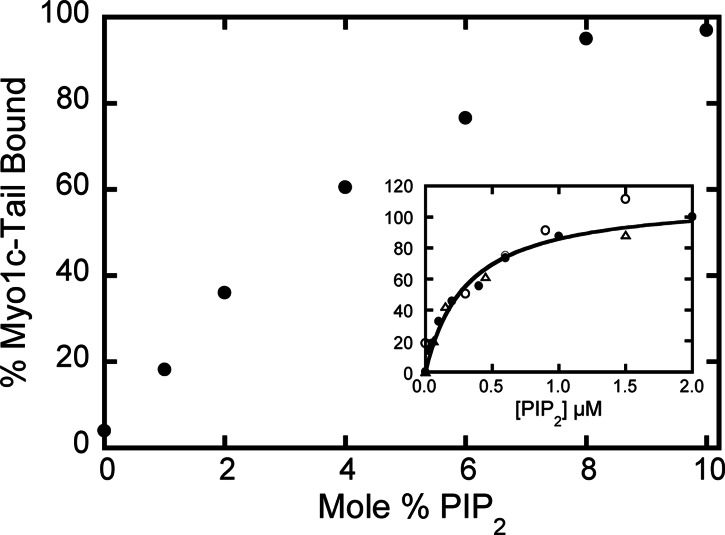
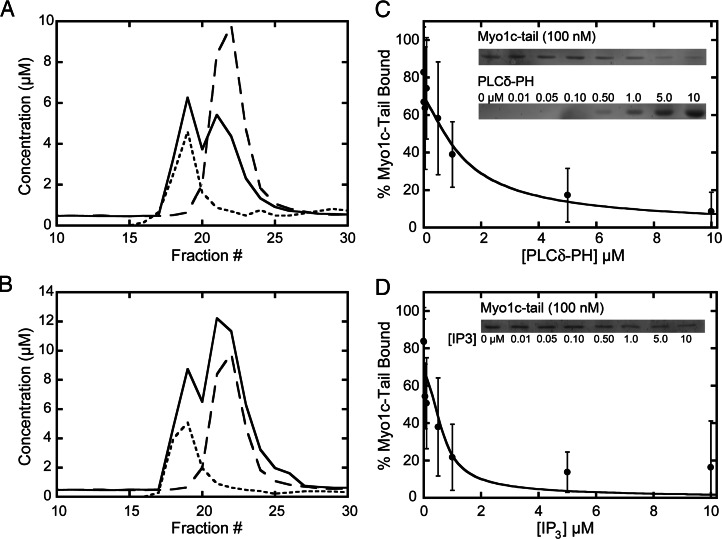
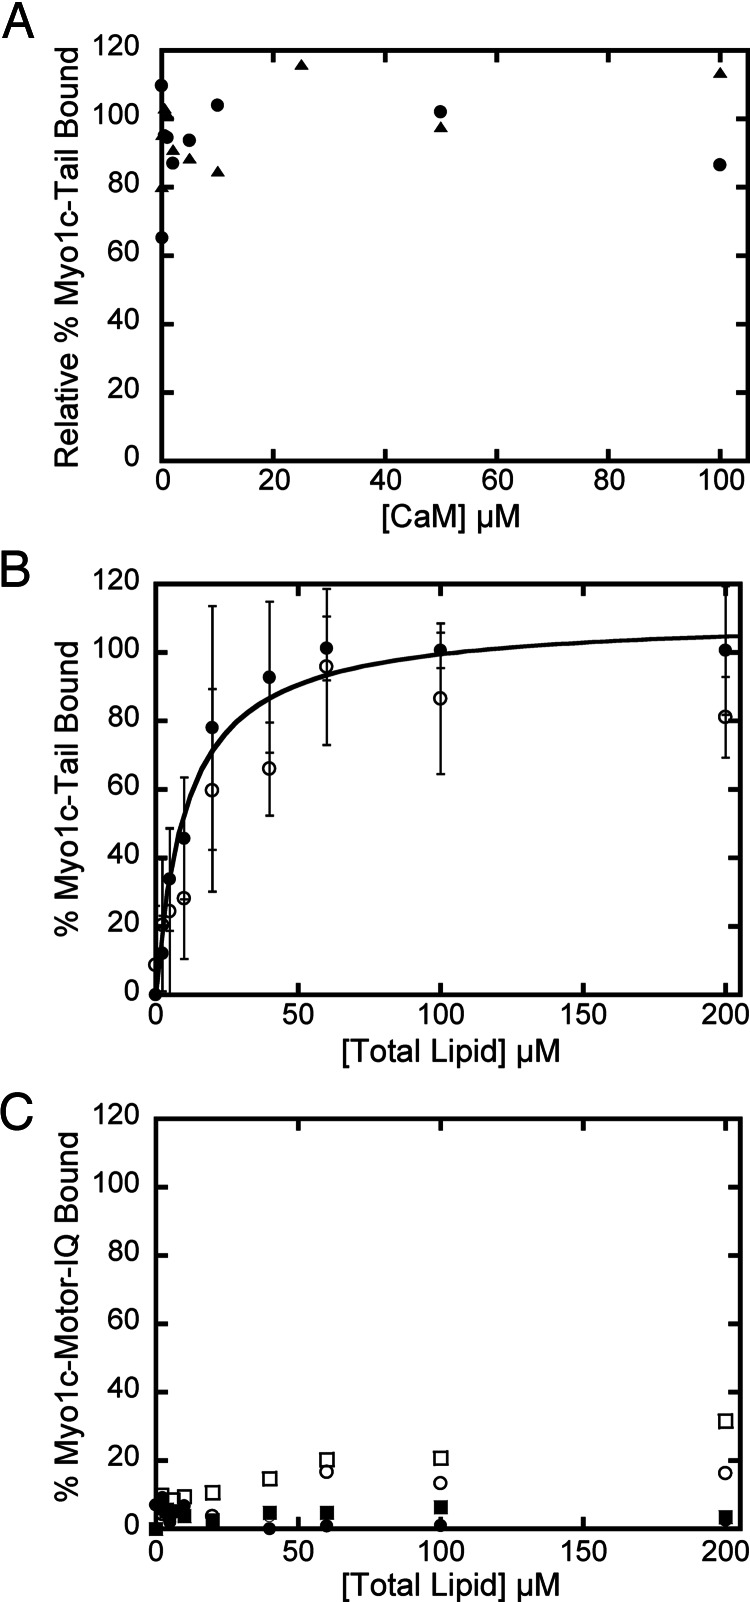
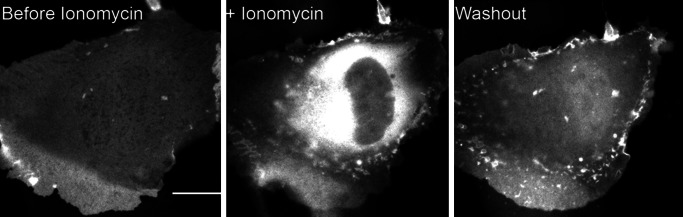
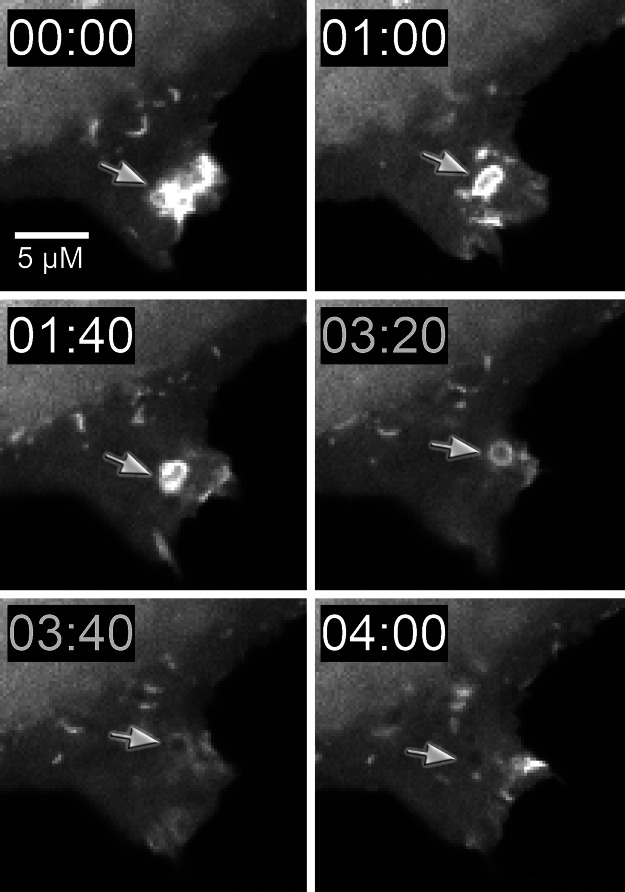
Myosin-I is the single-headed member of the myosin superfamily that associates with acidic phospholipids through its basic tail domain. Membrane association is essential for proper myosin-I localization and function. However, little is known about the physiological relevance of the direct association of myosin-I with phospholipids or about phospholipid headgroup-binding specificity. To better understand the mechanism of myosin-I-membrane association, we measured effective dissociation constants for the binding of a recombinant myo1c tail construct (which includes three IQ domains and bound calmodulins) to large unilamellar vesicles (LUVs) composed of phosphatidylcholine and various concentrations of phosphatidylserine (PS) or phosphatidylinositol 4,5-bisphosphate (PIP(2)). We found that the myo1c-tail binds tightly to LUVs containing >60% PS but very weakly to LUVs containing physiological PS concentrations (<40%). The myo1c tail and not the IQ motifs bind tightly to LUVs containing 2% PIP(2). Additionally, we found that the myo1c tail binds to soluble inositol-1,4,5-trisphosphate with nearly the same affinity as to PIP(2) in LUVs, suggesting that myo1c binds specifically to the headgroup of PIP(2). We also show that a GFP-myosin-I-tail chimera expressed in epithelial cells is transiently localized to regions known to be enriched in PIP(2). Our results suggest that myo1c does not bind to physiological concentrations of PS but rather binds tightly to PIP(2).
Conflict of interest statement
Conflict of interest statement: No conflicts declared.
Figures
Similar articles
-
Kinetics of the interaction of myo1c with phosphoinositides.J Biol Chem. 2009 Oct 16;284(42):28650-9. doi: 10.1074/jbc.M109.049791. Epub 2009 Aug 25. J Biol Chem. 2009. PMID: 19706607 Free PMC article.
-
Dynamics of myo1c (myosin-ibeta ) lipid binding and dissociation.J Biol Chem. 2002 Nov 8;277(45):42763-8. doi: 10.1074/jbc.M206388200. Epub 2002 Sep 6. J Biol Chem. 2002. PMID: 12221091
-
Myo1c binds phosphoinositides through a putative pleckstrin homology domain.Mol Biol Cell. 2006 Nov;17(11):4856-65. doi: 10.1091/mbc.e06-05-0449. Epub 2006 Sep 13. Mol Biol Cell. 2006. PMID: 16971510 Free PMC article.
-
Myo1e binds anionic phospholipids with high affinity.Biochemistry. 2010 Nov 2;49(43):9353-60. doi: 10.1021/bi1012657. Biochemistry. 2010. PMID: 20860408 Free PMC article.
-
Structure, function, and regulation of myosin 1C.Acta Biochim Pol. 2005;52(2):373-80. Epub 2005 May 31. Acta Biochim Pol. 2005. PMID: 15933767 Review.
Cited by
-
Protrusion growth driven by myosin-generated force.Dev Cell. 2023 Jan 9;58(1):18-33.e6. doi: 10.1016/j.devcel.2022.12.001. Dev Cell. 2023. PMID: 36626869 Free PMC article.
-
Kinetics of the interaction of myo1c with phosphoinositides.J Biol Chem. 2009 Oct 16;284(42):28650-9. doi: 10.1074/jbc.M109.049791. Epub 2009 Aug 25. J Biol Chem. 2009. PMID: 19706607 Free PMC article.
-
Quantitative analysis of the binding of ezrin to large unilamellar vesicles containing phosphatidylinositol 4,5 bisphosphate.Biophys J. 2008 Feb 1;94(3):1021-33. doi: 10.1529/biophysj.107.110213. Epub 2007 Sep 7. Biophys J. 2008. PMID: 17827228 Free PMC article.
-
Counterion-mediated cluster formation by polyphosphoinositides.Chem Phys Lipids. 2014 Sep;182:38-51. doi: 10.1016/j.chemphyslip.2014.01.001. Epub 2014 Jan 15. Chem Phys Lipids. 2014. PMID: 24440472 Free PMC article. Review.
-
Opposing Kinesin and Myosin-I Motors Drive Membrane Deformation and Tubulation along Engineered Cytoskeletal Networks.Curr Biol. 2018 Jan 22;28(2):236-248.e5. doi: 10.1016/j.cub.2017.12.007. Epub 2018 Jan 11. Curr Biol. 2018. PMID: 29337076 Free PMC article.
References
-
- Sokac A. M., Bement W. M. Int. Rev. Cytol. 2000;200:197–304. - PubMed
-
- Holt J. R., Gillespie S. K., Provance D. W., Shah K., Shokat K. M., Corey D. P., Mercer J. A., Gillespie P. G. Cell. 2002;108:371–381. - PubMed
-
- Ruppert C., Godel J., Muller R. T., Kroschewski R., Reinhard J., Bahler M. J. Cell. Sci. 1995;108:3775–3786. - PubMed
Publication types
MeSH terms
Substances
Grants and funding
LinkOut - more resources
Full Text Sources
Molecular Biology Databases
