. 2006 Mar;4(3):e69.
doi: 10.1371/journal.pbio.0040069. Epub 2006 Feb 28.

The cutaneous rabbit illusion affects human primary sensory cortex somatotopically

Affiliations

The cutaneous rabbit illusion affects human primary sensory cortex somatotopically

Felix Blankenburg et al. PLoS Biol. 2006 Mar.

Abstract

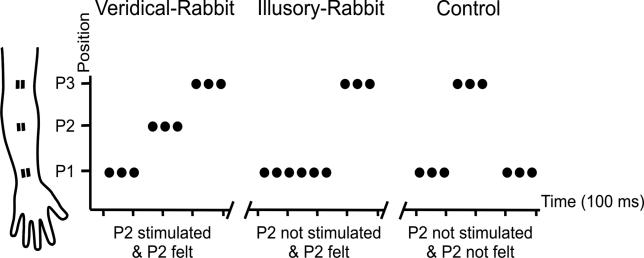
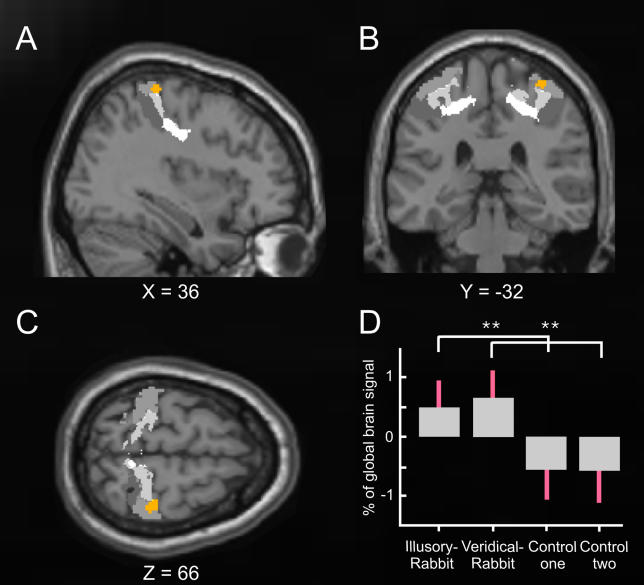
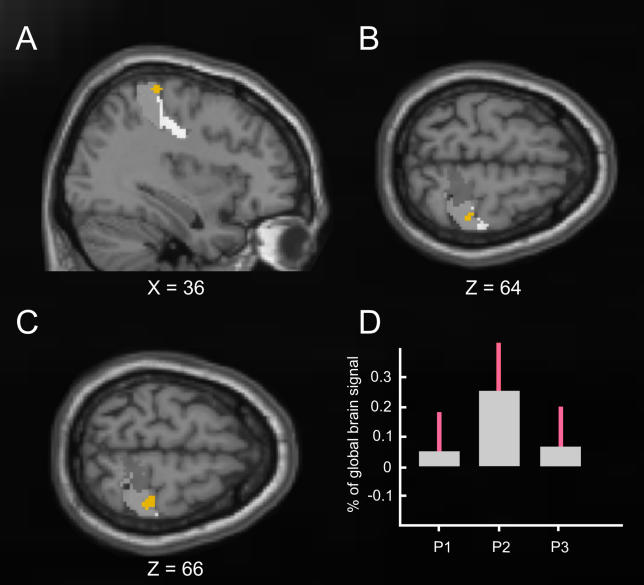
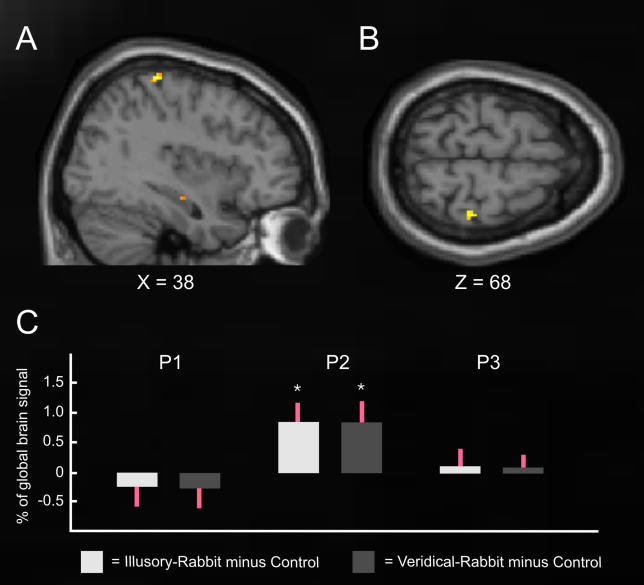
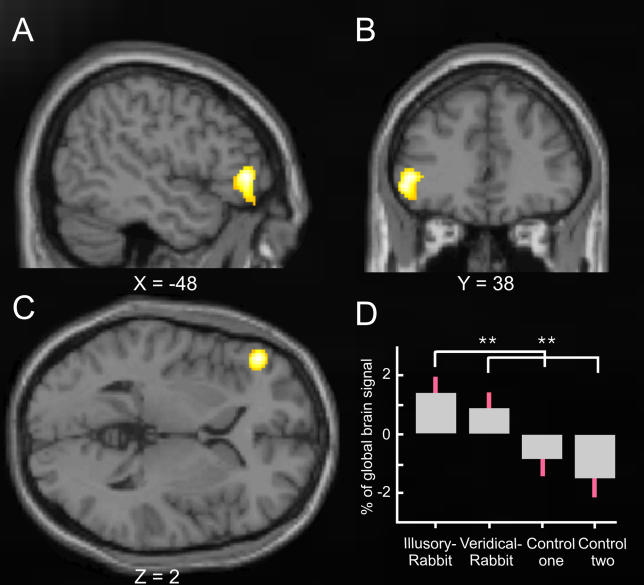
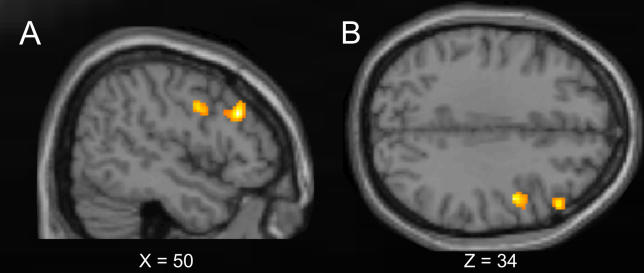
We used functional magnetic resonance imaging (fMRI) to study neural correlates of a robust somatosensory illusion that can dissociate tactile perception from physical stimulation. Repeated rapid stimulation at the wrist, then near the elbow, can create the illusion of touches at intervening locations along the arm, as if a rabbit hopped along it. We examined brain activity in humans using fMRI, with improved spatial resolution, during this version of the classic cutaneous rabbit illusion. As compared with control stimulation at the same skin sites (but in a different order that did not induce the illusion), illusory sequences activated contralateral primary somatosensory cortex, at a somatotopic location corresponding to the filled-in illusory perception on the forearm. Moreover, the amplitude of this somatosensory activation was comparable to that for veridical stimulation including the intervening position on the arm. The illusion additionally activated areas of premotor and prefrontal cortex. These results provide direct evidence that illusory somatosensory percepts can affect primary somatosensory cortex in a manner that corresponds somatotopically to the illusory percept.


Figures

Figure 1
Figure 1. Schematics of the Stimulus Sequences
Schematics of the stimulus sequences in the three main conditions (veridical-rabbit, illusory-rabbit, and control). The cartoon of the forearm schematically indicates the three different electrode positions (P1, P2, and P3). For the veridical-rabbit condition, three pulses at P1 were followed by three at P2 and then three at P3. The illusory-rabbit condition used a P1-P1-P3 sequence instead, but phenomenally, this was equivalent to the veridical-rabbit condition, with stimulation being felt around P2 for later repetitions at P1, despite no actual stimulation at P2. The control condition was a P1-P3-P1 sequence, thus stimulating the same two actual sites as for the illusory-rabbit condition, but now in a different sub-second order, which did not induce any illusion of stimulation around P2. The nine pulses in each condition were given in 400 ms.
Figure 2
Figure 2. Common Activation for the Illusory-Rabbit and the Veridical-Rabbit versus Control Conditions Embedded in Probabilistic Cytoarchitectonical Maps of BAs 3a, 3b, 1, and 2
Statistical T-maps (orange) obtained from the random-effects group analysis for the conjunction contrast of illusory-rabbit versus control data, and of veridical-rabbit versus the other (equivalent but independent) control dataset. The activation in right SI (peak at X = 36, Y = −32, Z = 66,p <0.005 for display purposes) is projected on the (A) sagittal, (B) coronal, and (C) transverse slices of the Montreal Neurological Institute standard brain, superimposed on gray-level-coded cytoarchitectonical probability maps (BA 3a in very light grey, BA 3b in light grey, BA 1 in grey, and BA 2 in deep grey), taken from Eickhoff et al. (2005). The plot (D) shows the parameter estimates for the experimental conditions (standard errors indicated in red), extracted from the peak of the activation (orange) in right SI. Note that both the veridical-rabbit and the illusory-rabbit conditions showed significantly higher activation than the two control datasets (seeMaterials and Methods for why the latter were split to allow conjunction analysis), which were equivalent, whereas the two rabbit conditions did not differ from each other.
Figure 3
Figure 3. Common Activation for the Illusory-Rabbit and the Veridical-Rabbit versus Control Conditions Embedded in the Localizer Results for Skin-Sites P1, P2, and P3
The brain images (A, B, C) again show the common activation (random-effects group analysis) for the veridical-rabbit and illusory-rabbit conditions in orange (peak at X = 36, Y = −32, Z = 66), now projected onto the differential contrasts for the localizer conditions (P1 versus P2 and P3 in bright gray, P2 versus P1 and P3 in intermediate gray, P3 versus P1 and P2 in dark gray) within BAs 3a, 3b, 1, and 2, as defined by the cytoarchitectonic atlas [11]. The differential activations for P1, P2, and P3 show the expected medial-to-lateral ordering for the different forearm positions (B and C). Although there is some spread in these localizer activations (as expected for smoothed fMRI data across a group, but see alsoFigure 4), note that the critical experimental activation for the two rabbit conditions (shown in orange here) clearly falls quite centrally within the localizer activation that corresponds to P2 (see B and C). Moreover, (D) plots the parameter estimates (SPM beta-values and standard errors in red) extracted from the region that was experimentally activated by the rabbit (orange), showing these for each of the separate group-localizer conditions. Note the stronger response to P2 than P3 or P1 here, as shown by the vast majority of individuals (9/10 and 8/10 respectively, see main text).
Figure 4
Figure 4. Common Activation for the Illusory-Rabbit and the Veridical-Rabbit versus Control Conditions with Less Spatial Smoothing
The brain images (A, B) show the common activation for the veridical-rabbit and illusory-rabbit in yellow (p < 0.001, uncorrected), from a group analysis using a considerably reduced smoothing kernel (4-mm FWHM). Note that the activation elicited by both the illusory- and veridical-rabbit (relative to the control) conditions is in virtually the identical location within SI (peak at X = 38, Y = −32, Z = 68) as before (seeFigure 3), and at the same threshold. Panel C shows the outcome of single-participant ROI analysis of the mean parameter estimates (SPM beta-values, from the analysis with 4-mm FWHM smoothing), extracted separately for each individual from the participant-specific locations within SI responding maximally to stimulation at P1, P2, or P3 (relative to the other two skin sites from these three) during the individual localizer sessions. The bars show the signal change during illusory- (left bar in each pair) and veridical- (right bar in each pair) rabbit, relative to the control conditions (standard errors indicated in red), for the individually defined cortical ROIs activated by P1, P2, or P3 stimulation (see above). This individual analysis thus confirms that both rabbit conditions led to significant activity increases (relative to control) only within the individual participant-specific cortical representations of P2, but not of P1 or P3. Thus, the rabbit-related activations corresponded to the skin location where stimulation was illusorily felt in the critical rabbit condition.
Figure 5
Figure 5. Common Activation for the Illusory-Rabbit and the Veridical-Rabbit versus Control Conditions beyond Somatosensory Cortex in the Whole-Brain Analysis
Regions beyond the somatosensory cortex that displayed activity increases during both illusory- and veridical-rabbit, relative to control conditions (whole-brain, random-effects, group analysis). The graph shows the statistical T-map of the conjunction contrast of illusory-rabbit versus control data, and veridical-rabbit versus the other (equivalent but independent) control dataset (p < 0.001 for display). This revealed activation of the left inferior frontal gyrus (peak at X = −48, Y = 38, Z = 2). The format for the plot in (D) is as for the analogous plot inFigure 2D. Note that the veridical-rabbit and the illusory-rabbit conditions showed significantly higher activation than the two control datasets, which were equivalent, whereas the two rabbit conditions did not differ from each other.
Figure 6
Figure 6. Activations for the Illusory-Rabbit versus the Veridical-Rabbit Conditions
Regions beyond the somatosensory cortex that were more active for the illusory- than veridical-rabbit sequences (whole-brain, random-effects, group analysis). The graph shows the statistical T-map for the contrast illusory-rabbit minus veridical-rabbit, projected onto: (A) sagittal and (B) transversal slices of the Montreal Neurological Institute standard brain (p <0.001 for display purposes). This contrast revealed activation of the right dorsal prefrontal cortex (middle frontal gyrus, peak at X = 50, Y = 28, Z = 30) and of the right premotor cortex (precentral/inferior frontal gyrus, peak at X = 48, Y = 0, Z = 34).

Comment in

References

    1. Rees G, Kreiman G, Koch C. Neural correlates of consciousness in humans. Nat Rev Neurosci. 2002;3:261–270. - PubMed
    1. Ress D, Heeger DJ. Neuronal correlates of perception in early visual cortex. Nat Neurosci. 2003;6:414–420. - PMC - PubMed
    1. Geldard FA, Sherrick CE. The cutaneous “rabbit”: A perceptual illusion. Science. 1972;178:178–179. - PubMed
    1. Eagleman DM, Sejnowski TJ. Motion integration and postdiction in visual awareness. Science. 2000;287:2036–2038. - PubMed
    1. Geldard FA. Sensory saltation: Metastability in the perceptual world. Hillsdale, NJ: Lawrence Erlbaum Associates; 1975. 133 pp.

Publication types