. 2006 Apr;18(4):760-93.
doi: 10.1162/089976606775774651.

Modeling sensorimotor learning with linear dynamical systems

Affiliations

Modeling sensorimotor learning with linear dynamical systems

Sen Cheng et al. Neural Comput. 2006 Apr.

Abstract

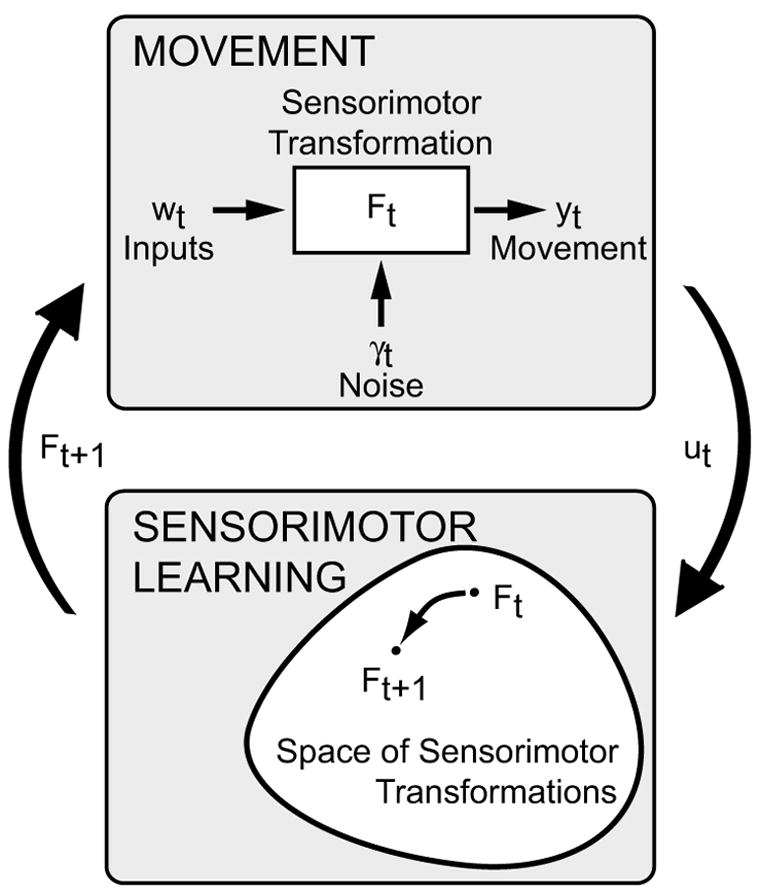
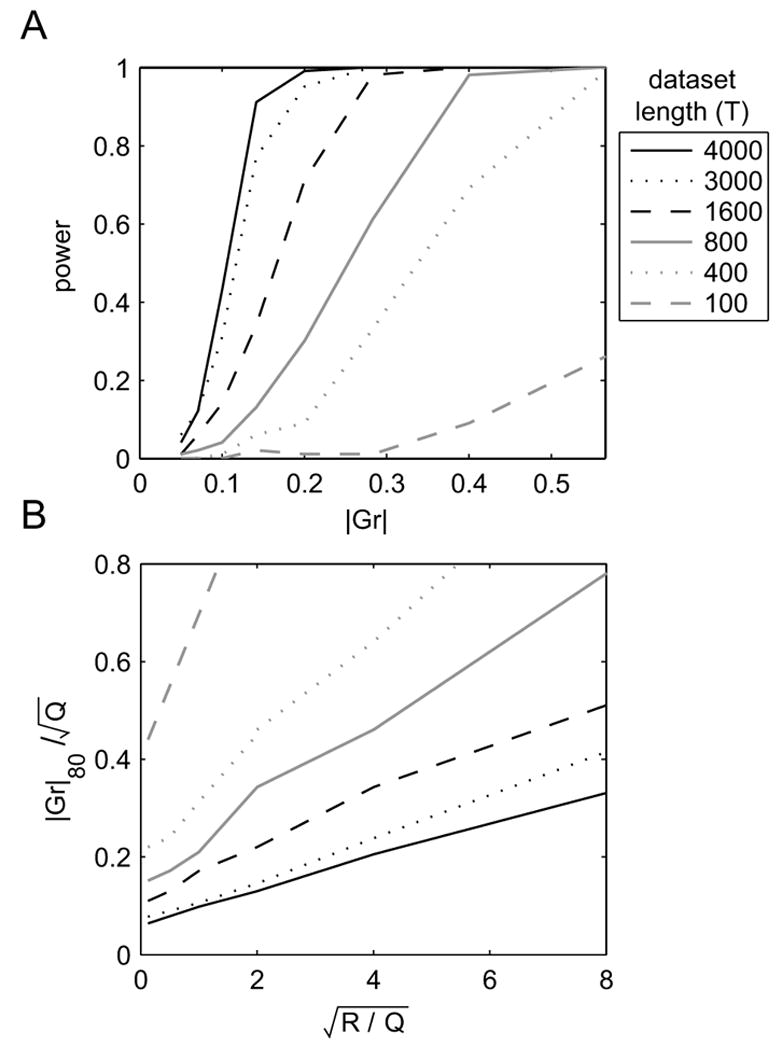
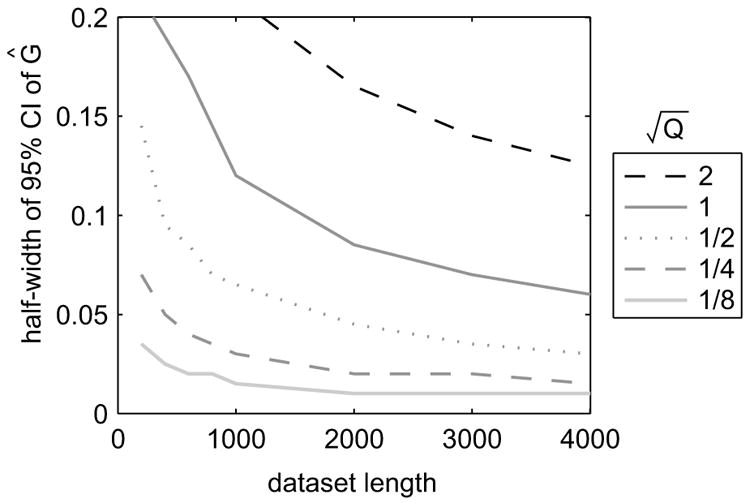
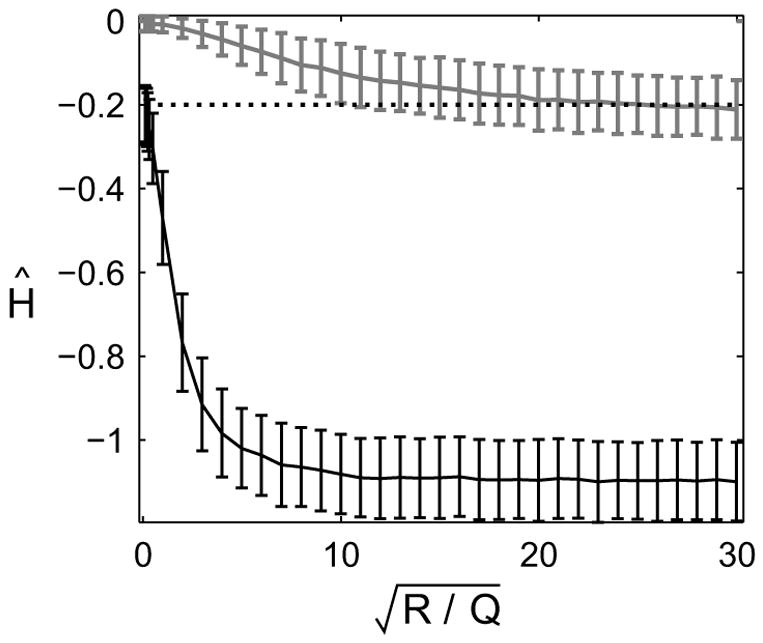
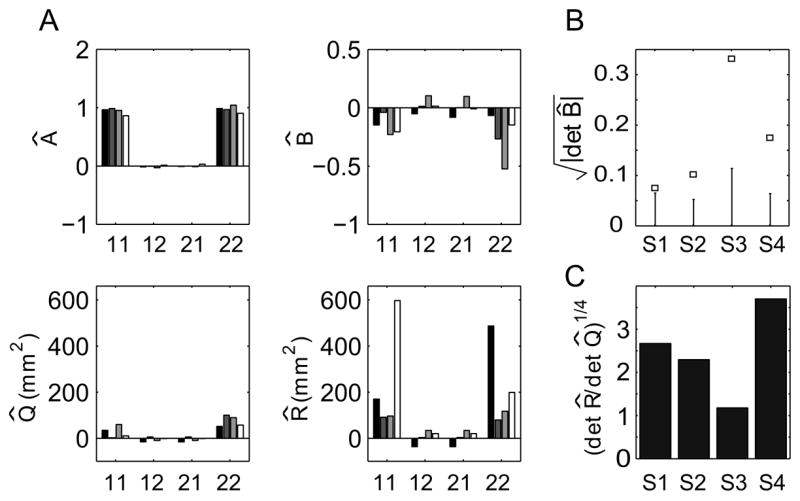
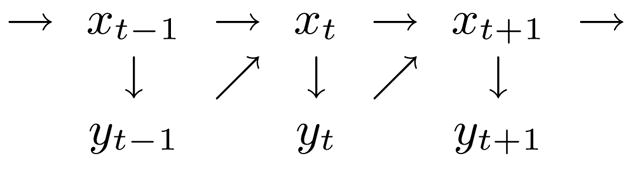
Recent studies have employed simple linear dynamical systems to model trial-by-trial dynamics in various sensorimotor learning tasks. Here we explore the theoretical and practical considerations that arise when employing the general class of linear dynamical systems (LDS) as a model for sensorimotor learning. In this framework, the state of the system is a set of parameters that define the current sensorimotor transformation-the function that maps sensory inputs to motor outputs. The class of LDS models provides a first-order approximation for any Markovian (state-dependent) learning rule that specifies the changes in the sensorimotor transformation that result from sensory feedback on each movement. We show that modeling the trial-by-trial dynamics of learning provides a substantially enhanced picture of the process of adaptation compared to measurements of the steady state of adaptation derived from more traditional blocked-exposure experiments. Specifically, these models can be used to quantify sensory and performance biases, the extent to which learned changes in the sensorimotor transformation decay over time, and the portion of motor variability due to either learning or performance variability. We show that previous attempts to fit such models with linear regression have not generally yielded consistent parameter estimates. Instead, we present an expectation-maximization algorithm for fitting LDS models to experimental data and describe the difficulties inherent in estimating the parameters associated with feedback-driven learning. Finally, we demonstrate the application of these methods in a simple sensorimotor learning experiment: adaptation to shifted visual feedback during reaching.


Figures

FIG. 1
FIG. 1
Sensorimotor learning modeled as a dynamic system in the space of sensorimotor transformations. For definitions of variables see Section II.A.
FIG. 2
FIG. 2
Illustration of the difference between trial-by-trial state of adaptation (connected arrows) and steady-state of adaptation (open circles) in a simple simulation of error corrective learning. The data were simulated with no noise and with diagonal matrices G = H. The learning rate in the x-direction, H11, was 40% smaller than in the y-direction, H22. Four different input vectors rt=yt were used, as shown in the inset in the corresponding shade of gray.
FIG. 3
FIG. 3
Correlations between LDS parameter estimates across 1000 simulated datasets. Each panel corresponds to a particular value for T and R/Q. Simulations used an LDS with parameters A = 0.8, |Gr| = 0.5, H = −0.2, C = 1, D = 0, Q = 1, and zero-mean, white noise inputs rt with unit variance.
FIG. 4
FIG. 4
Uncertainty in the feedback parameter Ĥ in two different constraint conditions. All data were simulated with parameters A = 0.8, H = −0.2, C = 1, D = 0. Q sets the scale. A: Variability of Ĥ as a function of the output noise magnitude, when all other parameters, in particular A, are known (T = 400 trials). Lines correspond to different values of the magnitude of the exogenous input signal. B: Variability of Ĥ as a function of dataset length, T, for |Gr| = 0 (no exogenous input). Lines correspond to different levels of output noise. C and D: Variability of Ĥ when both H and A are unknown, but A + HC, as well as all other parameters, are known; otherwise as in A and B, respectively.
FIG. 5
FIG. 5
Power analysis of the permutation test for the significance of G. Simulation parameters: A = 0.8, H = −0.2, C = 1, and D = 0. Q sets the scale. A: Statistical power when R/Q=2. B: Input magnitude required to achieve 80% power, as a ratio of Q. In both panels, α = 0.05 and line type indicates the dataset length T.
FIG. 6
FIG. 6
95%-confidence intervals for the MLE of the input parameter G, computed from 1000 simulated datasets. All simulations were run with R/Q=2 and Gaussian white noise inputs with zero-mean and unit variance. A = 0.8, G = −0.3, H = −0.2, C = 1, and D = 0.
FIG. 7
FIG. 7
Bias in Ĥ using two different linear regression fits of simulated data. The datasets were simulated with no exogenous inputs and the LDS model parameters A = 1, G = 0, H = −0.2, C = 1, and D = 0. Q sets the scale. The lower (black) data points represent the average Ĥ over 1000 simulated datasets using the subtraction approach. The upper (gray) data points are for the summation approach. The true value of H is shown as the dotted line. Error-bars represent standard deviations.
FIG. 8
FIG. 8
A: Estimated LDS parameters  , , , and for four subjects. Labels on the x-axis indicate the components of each matrix. Each bar shading corresponds to a different subject (S1–S4). B: Results of permutation test for the input parameter B for each subject. The square marks detB^ and the errorbars show the 95% confidence interval for that value given H0 : det B = 0, generated from 1000 permuted datasets. C: Estimate of ratio of output to learning noise standard deviation.
FIG. 9
FIG. 9
Graphical model of the statistical relationship between the states and the outputs of the closed-loop system. The dependence on the deterministic inputs has been suppressed for clarity.

References

    1. Anderson BDO, Moore JB. Optimal Filtering. Prentice-Hall; Englewood Cliffs, N.J: 1979.
    1. Baddeley RJ, Ingram HA, Miall RC. System identification applied to a visuomotor task: Near-optimal human performance in a noisy changing task. J Neurosci. 2003;23(7):3066–3075. - PMC - PubMed
    1. Baraduc P, Wolpert DM. Adaptation to a visuomotor shift depends on the starting posture. J Neurophysiol. 2002;88(2):973–981. - PubMed
    1. Clamann HP. Statistical analysis of motor unit firing patterns in a human skeletal muscle. Biophys J. 1969;9(10):1233–1251. - PMC - PubMed
    1. Dempster AP, Laird NM, Rubin DB. Maximum likelihood from incomplete data via the EM algorithm. J Royal Statistical Society, Series B. 1977;39:1–38.

Publication types