

doi: 10.3201/eid1201.050593.
Real-time estimates in early detection of SARS
Affiliations
- PMID: 16494726
- PMCID: PMC3293464
- DOI: 10.3201/eid1201.050593
Item in Clipboard
Real-time estimates in early detection of SARS
Emerg Infect Dis.
2006 Jan.
Abstract
We propose a Bayesian statistical framework for estimating the reproduction number R early in an epidemic. This method allows for the yet-unrecorded secondary cases if the estimate is obtained before the epidemic has ended. We applied our approach to the severe acute respiratory syndrome (SARS) epidemic that started in February 2003 in Hong Kong. Temporal patterns of R estimated after 5, 10, and 20 days were similar. Ninety-five percent credible intervals narrowed when more data were available but stabilized after 10 days. Using simulation studies of SARS-like outbreaks, we have shown that the method may be used for early monitoring of the effect of control measures.
Figures
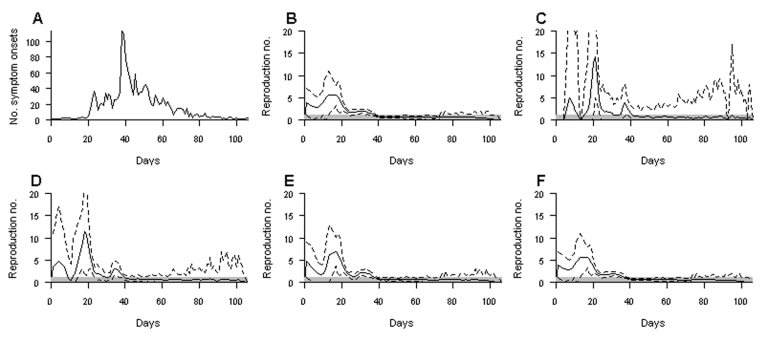
Application of real-time estimation to the severe acute respiratory syndrome outbreak in Hong Kong. A) Data. B–F) Expectation (solid lines) and 95% credible intervals (dashed lines) of the real-time estimator of Rt were calculated at the end of the epidemic (B) and after a lag of 2 (C), 5 (D), 10 (E), and 20 (F) days. The gray zones indicate that R is <1.
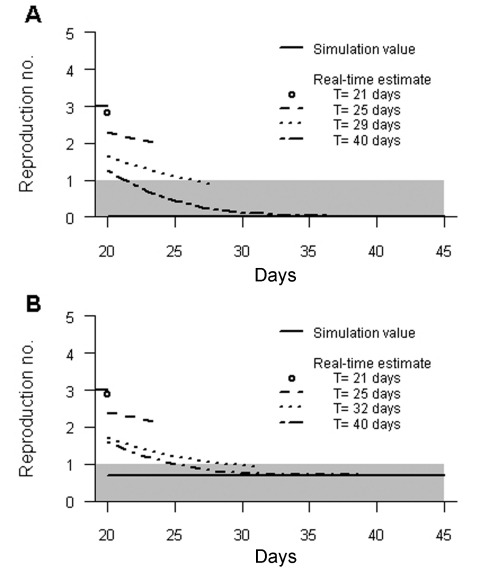
Average expectation of the temporal pattern of Rt after implementation of control measures according to the day T of the last observation. A) Completely effective control measures. B) Limited control measures. Simulation values of R are also given: before day 20, R = 3; after day 20 R = 0 (A) and R = 0.7 (B). The gray zone indicates that R is <1. Information that the average expectation of R has passed <1 was obtained 9 (A) and 12 (B) days after control measures were implemented.
References
-
- Leung GM, Hedley AJ, Ho LM, Chau P, Wong IO, Thach TQ, et al. The epidemiology of severe acute respiratory syndrome in the 2003 Hong Kong epidemic: an analysis of all 1,755 patients. Ann Intern Med. 2004;141:662–73. - PubMed
Publication types
MeSH terms
LinkOut - more resources
Full Text Sources
Miscellaneous