. 2006 Mar;12(3):342-52.
doi: 10.1261/rna.2164906.

RNA secondary structure prediction from sequence alignments using a network of k-nearest neighbor classifiers

Affiliations

RNA secondary structure prediction from sequence alignments using a network of k-nearest neighbor classifiers

Eckart Bindewald et al. RNA. 2006 Mar.

Abstract

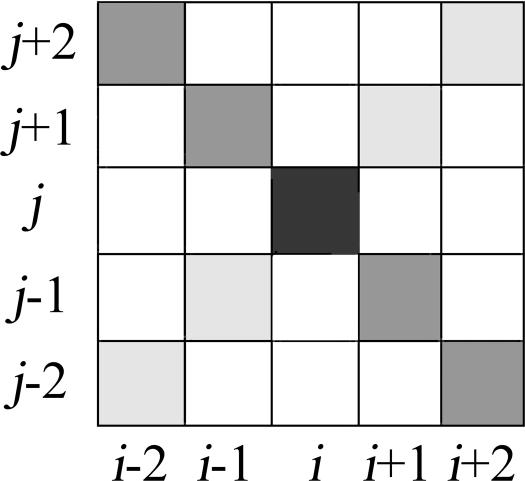
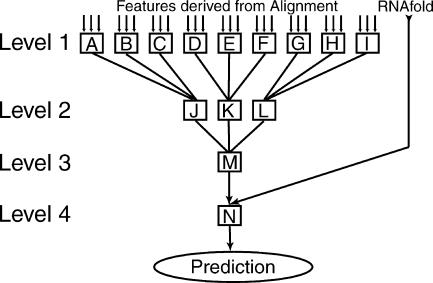
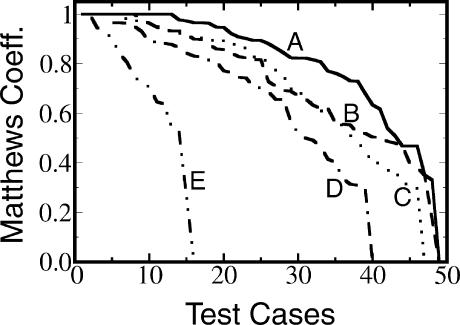
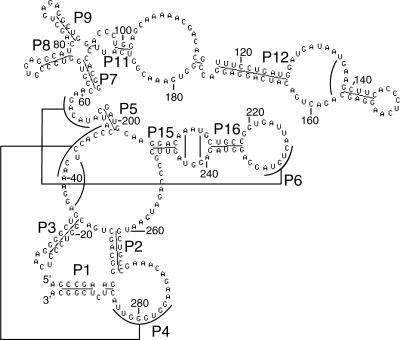
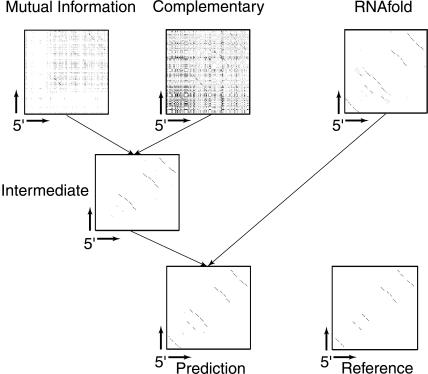
We present a machine learning method (a hierarchical network of k-nearest neighbor classifiers) that uses an RNA sequence alignment in order to predict a consensus RNA secondary structure. The input to the network is the mutual information, the fraction of complementary nucleotides, and a novel consensus RNAfold secondary structure prediction of a pair of alignment columns and its nearest neighbors. Given this input, the network computes a prediction as to whether a particular pair of alignment columns corresponds to a base pair. By using a comprehensive test set of 49 RFAM alignments, the program KNetFold achieves an average Matthews correlation coefficient of 0.81. This is a significant improvement compared with the secondary structure prediction methods PFOLD and RNAalifold. By using the example of archaeal RNase P, we show that the program can also predict pseudoknot interactions.


Figures

FIGURE 1.
FIGURE 1.
Schematic plot of feature positions used as input for prediction with respect to base pairs i,j. Dark gray and black indicate positions used for mutual information and fraction of complementary pairs; light gray, feature positions used only for mutual information.
FIGURE 2.
FIGURE 2.
Structure of network of k-nearest neighbor classifiers. The classifier network computes a prediction whether or not a given pair of columns of an alignment corresponds to a base pair of the consensus secondary structure. It needs a set of features derived from a sequence alignment and an RNAfold consensus probability matrix. A–I indicate classifiers of level 1. Each classifier uses three features derived from the alignment. J–M indicate classifiers of level two and three. Each classifier of that level has as input the output from three classifiers of the previous level. N indicates a final classifier that has as input (1) the output from the classifier of the previous level and (2) the RNAfold consensus probability value for the given pair of columns.
FIGURE 3.
FIGURE 3.
Prediction accuracy for the test set of 49 RFAM alignments. A indicates method presented in this article (KNetFold); B, nonlinear RNAfold consensus probability matrix (NL-RNAfold); C, PFOLD Web server; D, RNAalifold; E, intermediate result (corresponds to output of classifier M in Figure 2 ▶ and “Intermediate” in Table 1 ▶). The data shown correspond to the results of RFAM alignments in the test set. For each method, the highest prediction accuracies are plotted leftmost. If the original RFAM alignment contained >40 sequences, a “thinned” alignment consisting of 40 representative sequences was used instead.
FIGURE 4.
FIGURE 4.
RNA secondary structure prediction for archaeal RNase P (sequence of Methanobacterium thermoautotrophicum ΔH, GenBank: AF295979). The labeling of the helices is according to references Haas et al. (1994) and Harris et al. (2001). Most helices are in agreement with the structure published in Harris et al. (2001). Two pseudoknot interactions are predicted. Part of the picture was generated with the help of the program STRUCTURELAB (Shapiro and Kasprzak 1996).
FIGURE 5.
FIGURE 5.
U2 spliceosomal RNA: example of processing matrices of features to a final secondary structure prediction. The matrices shown correspond to possible interactions of the positions of the first sequence in the RFAM seed alignment for RF00004. The 5′ end of the alignment corresponds to the lower left corner of the shown matrices. The matrices are as follows: Mutual Information, mutual information between two alignment columns; Complementary, fraction of Watson-Crick and GU base pairs; RNAfold, RNAfold consensus probability matrix; Intermediate, output matrix of classifier network not using RNAfold; Prediction, final prediction produced by the classifier network; and Reference, reference structure provided by RFAM.

References

    1. Akmaev, V.R., Kelley, S.T., and Stormo, G.D. 2000. Phylogeneticically enhanced statistical tools for RNA structure prediction. Bioinformatics 16: 501–512. - PubMed
    1. Arya, S. and Mount, D.M. 1993. Algorithms for fast vector quantization. Proceedings of DCC ’93: Data compression conference (eds. J.A. Storer, and M. Cohn), pp. 381–390. IEEE Press, Snowbird, UT.
    1. Baldi, P., Brunak, S., Chauvin, Y., Anderson, C., and Nielsen, H. 2000. Assessing the accuracy of prediction algorithms for classification: An overview. Bioinformatics 16: 412–424. - PubMed
    1. Basharin, G.P. 1959. On a statistical estimate for the entropy of a sequence of independent random variables. Theory Probability Appl. 4: 333–336.
    1. Brown, J.W. 1999. The Ribonuclease P Database. Nucleic Acids Res. 27: 314. - PMC - PubMed

Publication types