Comparative Study
. 2006 Mar;50(3):1021-33.
doi: 10.1128/AAC.50.3.1021-1033.2006.

Susceptibility of Cryptococcus neoformans biofilms to antifungal agents in vitro

Affiliations
Comparative Study

Susceptibility of Cryptococcus neoformans biofilms to antifungal agents in vitro

Luis R Martinez et al. Antimicrob Agents Chemother. 2006 Mar.

Abstract

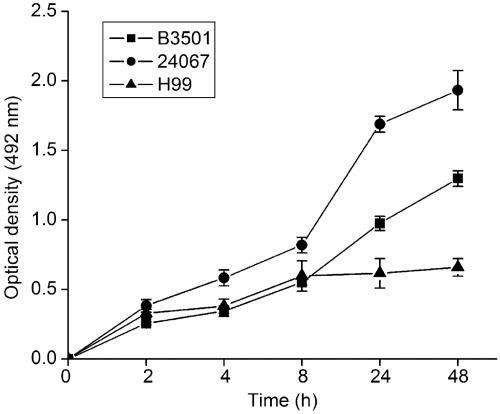
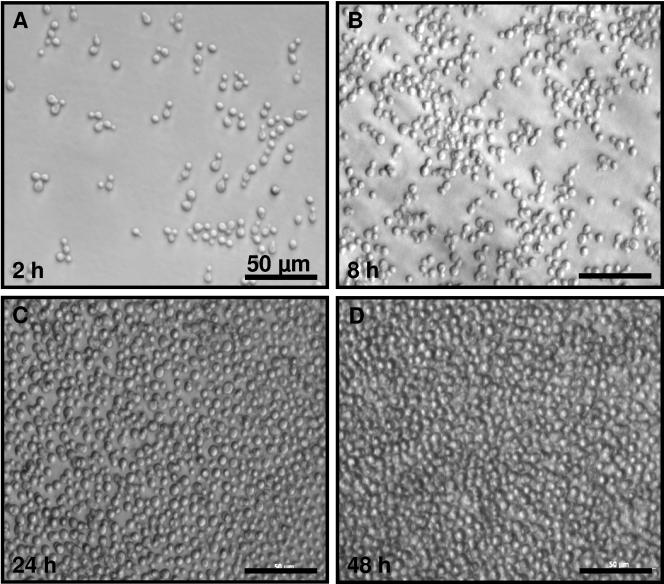
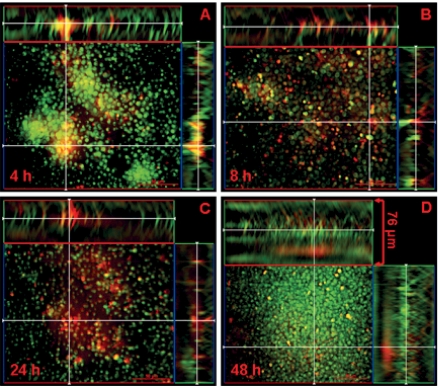
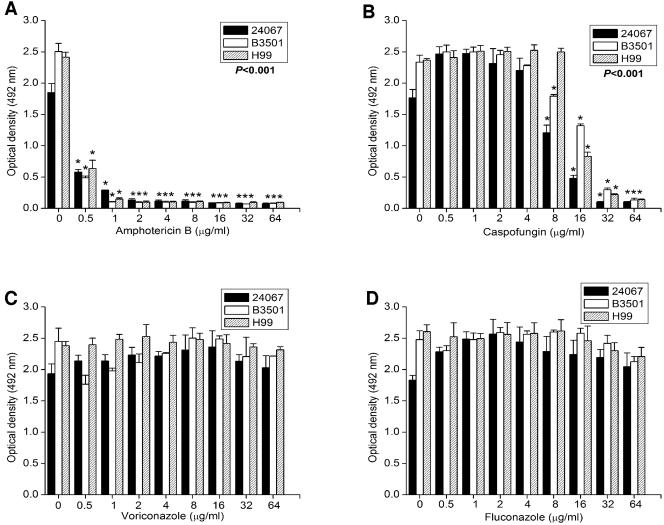
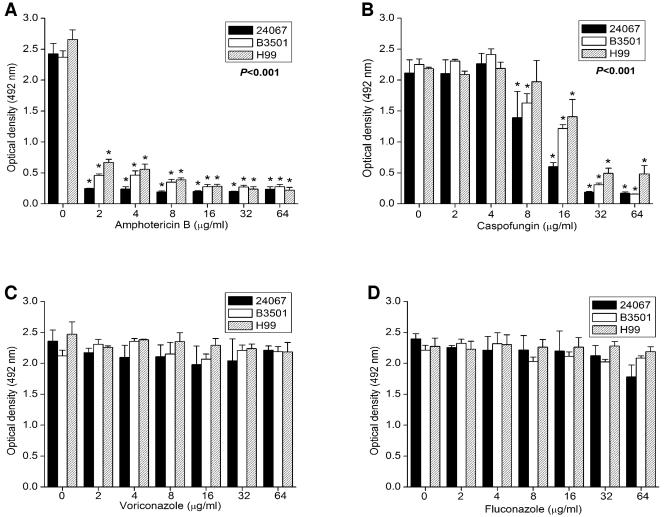
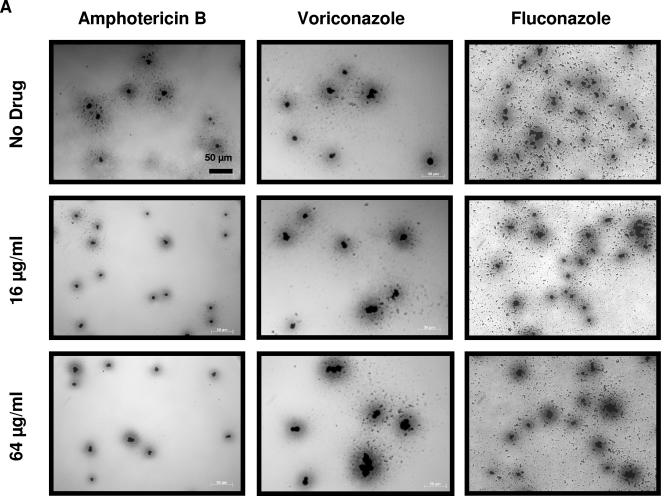
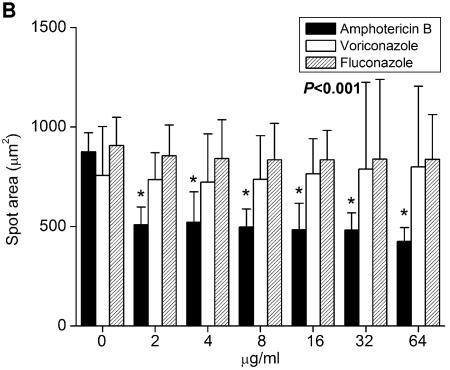
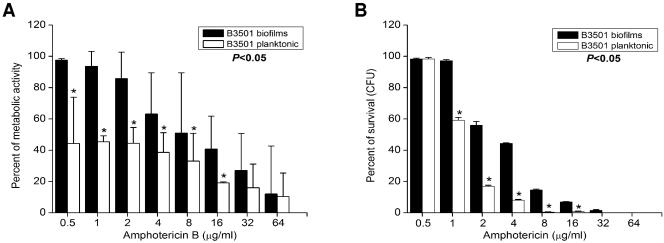
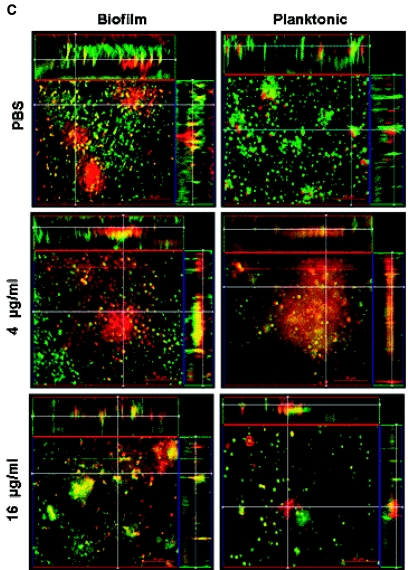
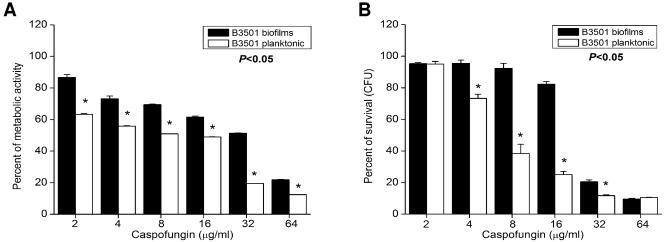
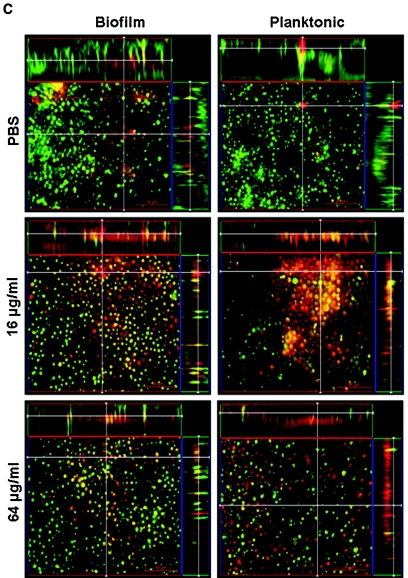
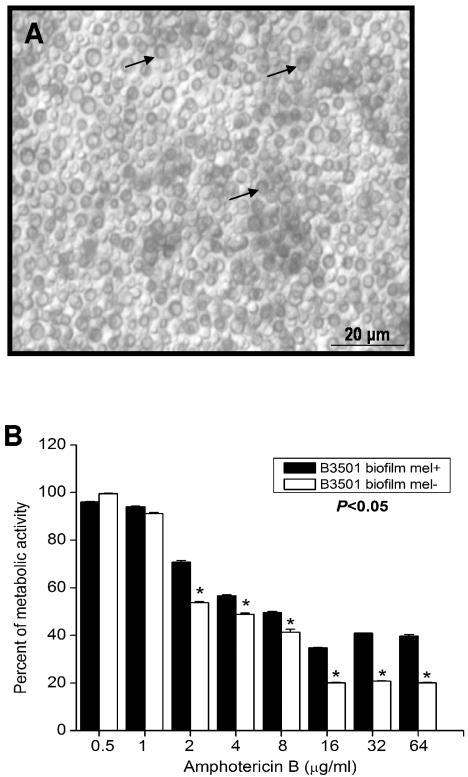
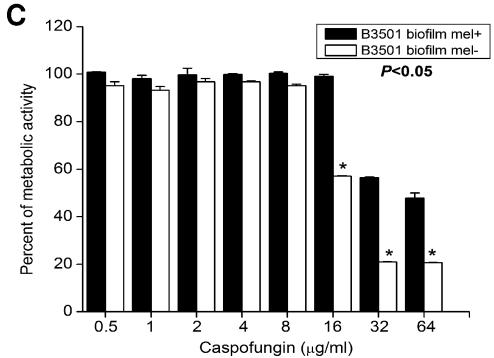
Microbial biofilms contribute to virulence and resistance to antibiotics by shielding microbial cells from host defenses and antimicrobial drugs, respectively. Cryptococcus neoformans was demonstrated to form biofilms in polystyrene microtiter plates. The numbers of CFU of disaggregated biofilms, 2,3-bis(2-methoxy-4-nitro-5-sulfophenyl)-5-[(phenylamino)carbonyl]-2H-tetrazolium hydroxide reduction, and light and confocal microscopy were used to measure the fungal mass, the metabolic activity, and the appearance of C. neoformans biofilms, respectively. Biofilm development by C. neoformans followed a standard sequence of events: fungal surface attachment, microcolony formation, and matrix production. The susceptibilities of C. neoformans cells of the biofilm and planktonic phenotypes to four antifungal agents were examined. The exposure of C. neoformans cells or preformed cryptococcal biofilms to fluconazole or voriconazole did not result in yeast growth inhibition and did not affect the metabolic activities of the biofilms, respectively. In contrast, both C. neoformans cells and preformed biofilms were susceptible to amphotericin B and caspofungin. However, C. neoformans biofilms were significantly more resistant to amphotericin B and caspofungin than planktonic cells, and their susceptibilities to these drugs were further reduced if cryptococcal cells contained melanin. A spot enzyme-linked immunosorbent assay and light and confocal microscopy were used to investigate how antifungal drugs affected C. neoformans biofilm formation. The mechanism by which amphotericin B and caspofungin interfered with C. neoformans biofilm formation involved capsular polysaccharide release and adherence. Our results suggest that biofilm formation may diminish the efficacies of some antifungal drugs during cryptococcal infection.


Figures

FIG. 1.
FIG. 1.
Kinetics of C. neoformans biofilm formation in polystyrene microtiter plates, as determined by the colorimetric XTT reduction assay. The average of three XTT assay measurements was taken. This experiment was done twice, with similar results each time.
FIG. 2.
FIG. 2.
Light microscopy images of C. neoformans strain B3501 biofilms after forceful washing with a microtiter plate washer. (A) Adhesion phase (2 h). The cryptococcal cells adhered to the bottom of the wells. At this stage the early biofilm is composed of cells undergoing budding or fungal growth in a monolayer fashion. (B) Intermediate phase (8 h). After attachment of the cryptococcal cells to the polystyrene plate, fungal growth involves the formation of microcolonies consisting of clustered cells. (C and D) Mature phase (24 to 48 h). A dense network of yeast cells bound to each other is formed by a combination of capsular polysaccharide fibers and extracellular material, creating a tenacious layer consisting of cells enmeshed in a polysaccharide matrix. At this point the thickness of the biofilm consists of several layers of cells. The pictures were taken by using a ×40 power field. Scale bars, 50 μm.
FIG. 3.
FIG. 3.
Confocal microscopic images of C. neoformans strain B3501 biofilm grown on polystyrene plates reveal the organization of biofilm development. Orthogonal images of C. neoformans biofilm formation showed metabolically active (red, FUN-1-stained) cells embedded in the polysaccharide extracellular material (green, ConA-stained). For each panel (A to D), a top view of the biofilm sections is shown below the red line, and to the left of the blue line the images denote a Z-stack reconstruction. White lines indicate the location of the Z-stack sections in relation to the top view. The thickness of the biofilm can be observed in the upper and right side views of the Z-stack reconstruction. (A) Adhesion phase (4 h). The cryptococcal cells adhere to the bottom of the wells in a monolayer arrangement. Metabolically active fungal cells are concentrated in a small region of the field. (B) Intermediate phase (8 h). After attachment of the cryptococcal cells to the polystyrene plate, fungal growth and the increase in metabolic activity involve microcolony formation. (C) Early maturation phase (24 h). Exopolymeric matrix production of the cryptococcal biofilm begins. The metabolic activity of the biofilm remains high and steady. (D) Mature phase (48 h). The mature C. neoformans biofilm reveals a complex structure with internal regions of metabolically active cells interwoven with extracellular polysaccharide material. The thickness of a mature biofilm is approximately 76 μm. The pictures were taken by using a ×40 power field. Scale bars, 50 μm.
FIG. 4.
FIG. 4.
Effects of four antifungal drugs on C. neoformans biofilm formation. The metabolic activities of C. neoformans strains 24067, B3501, and H99 were measured by the XTT reduction assay. Yeast cells were exposed to various concentrations (0.5, 1, 2, 4, 8, 16, 32, and 64 μg/ml) of amphotericin B (A), caspofungin (B), voriconazole (C), or fluconazole (D) for 24 h; and their biofilm production was compared to that of fungal cells incubated in PBS. Bars are the averages of three XTT measurements, and brackets denote standard deviations. Asterisks denote P value significance, calculated by analysis of variance and adjusted by use of the Bonferroni correction. This experiment was done twice, with similar results each time.
FIG. 5.
FIG. 5.
Susceptibilities of C. neoformans biofilms to antifungal drugs. The metabolic activities of the biofilms produced by C. neoformans strains 24067, B3501, and H99 were measured by the XTT reduction assay. Biofilms were exposed to various concentrations (2, 4, 8, 16, 32, and 64 μg/ml) of amphotericin B (A), caspofungin (B), voriconazole (C), or fluconazole (D) for 24 h; and their susceptibilities were compared to those of biofilms incubated in PBS. Bars are the averages of three XTT measurements, and brackets denote standard deviations. Asterisks denote P value significance, calculated by analysis of variance and adjusted by use of the Bonferroni correction. This experiment was done twice, with similar results each time.
FIG.6.
FIG.6.
Effects of antifungal drugs during the adhesion stage of C. neoformans biofilm formation. (A) Light microscopic images of spots formed by C. neoformans strain B3501 during the spot ELISA. Images were obtained after 2 h of exposure of the fungal cells to various concentrations (16 and 64 μg/ml) of amphotericin B, voriconazole, or fluconazole; and the images were compared with those of yeast cells incubated in presence of PBS. The pictures were taken by using a ×20 power field. Scale bars, 50 μm. The results are representative of those of two experiments. (B) The release of C. neoformans strain B3501 GXM was visualized by the spot ELISA after exposure of the yeast cells for 2 h to various concentrations (2, 4, 8, 16, 32, and 64 μg/ml) of amphotericin B, voriconazole, or fluconazole. Fungal cells incubated in the presence of PBS were used as a control. Bars are the averages of the areas of 20 spots per power field, with the area being calculated by the equation πr2. Five power fields were observed for each time interval. Brackets denote standard deviations. Asterisks denote P value significance, calculated by analysis of variance and adjusted by use of the Bonferroni correction.
FIG.6.
FIG.6.
Effects of antifungal drugs during the adhesion stage of C. neoformans biofilm formation. (A) Light microscopic images of spots formed by C. neoformans strain B3501 during the spot ELISA. Images were obtained after 2 h of exposure of the fungal cells to various concentrations (16 and 64 μg/ml) of amphotericin B, voriconazole, or fluconazole; and the images were compared with those of yeast cells incubated in presence of PBS. The pictures were taken by using a ×20 power field. Scale bars, 50 μm. The results are representative of those of two experiments. (B) The release of C. neoformans strain B3501 GXM was visualized by the spot ELISA after exposure of the yeast cells for 2 h to various concentrations (2, 4, 8, 16, 32, and 64 μg/ml) of amphotericin B, voriconazole, or fluconazole. Fungal cells incubated in the presence of PBS were used as a control. Bars are the averages of the areas of 20 spots per power field, with the area being calculated by the equation πr2. Five power fields were observed for each time interval. Brackets denote standard deviations. Asterisks denote P value significance, calculated by analysis of variance and adjusted by use of the Bonferroni correction.
FIG.7.
FIG.7.
C. neoformans biofilms are more resistant to amphotericin B than planktonic cells. (A) The percentage of metabolic activity of C. neoformans strain B3501 biofilms and planktonic cells was measured by the XTT reduction assay. Both phenotypes were exposed to various concentrations (0.5, 1, 2, 4, 8, 16, 32, and 64 μg/ml) of amphotericin B for 24 h; and their metabolic activities were compared to those of fungal cells incubated in PBS. (B) The percent survival of C. neoformans strain B3501 biofilms and planktonic cells was measured by determination of the numbers of CFU. Both phenotypes were exposed to various concentrations (0.5, 1, 2, 4, 8, 16, 32, and 64 μg/ml) of amphotericin B for 24 h; and their rates of survival were compared to those of fungal cells incubated in PBS. For panels A and B, the bars are the averages of three measurements, and brackets denote standard deviations. Asterisks denote P value significance, calculated by analysis of variance and adjusted by use of the Bonferroni correction. This experiment was done twice, with similar results each time. (C) CM of C. neoformans B3501 biofilms and planktonic cells treated with amphotericin B. Orthogonal images of mature C. neoformans biofilms and planktonic cells showed metabolically active (red, FUN-1-stained) cells embedded in the polysaccharide extracellular material (green, ConA stained), while the yellow-brownish areas represent metabolically inactive or nonviable cells. Images were obtained after 24 h of exposure of the fungal cells to various concentrations (4 and 16 μg/ml) of amphotericin B, and the images were compared with those of yeast cells incubated in presence of PBS. The pictures were taken by using a ×40 power field. Scale bars, 50 μm. The results are representative of those of two experiments.
FIG.7.
FIG.7.
C. neoformans biofilms are more resistant to amphotericin B than planktonic cells. (A) The percentage of metabolic activity of C. neoformans strain B3501 biofilms and planktonic cells was measured by the XTT reduction assay. Both phenotypes were exposed to various concentrations (0.5, 1, 2, 4, 8, 16, 32, and 64 μg/ml) of amphotericin B for 24 h; and their metabolic activities were compared to those of fungal cells incubated in PBS. (B) The percent survival of C. neoformans strain B3501 biofilms and planktonic cells was measured by determination of the numbers of CFU. Both phenotypes were exposed to various concentrations (0.5, 1, 2, 4, 8, 16, 32, and 64 μg/ml) of amphotericin B for 24 h; and their rates of survival were compared to those of fungal cells incubated in PBS. For panels A and B, the bars are the averages of three measurements, and brackets denote standard deviations. Asterisks denote P value significance, calculated by analysis of variance and adjusted by use of the Bonferroni correction. This experiment was done twice, with similar results each time. (C) CM of C. neoformans B3501 biofilms and planktonic cells treated with amphotericin B. Orthogonal images of mature C. neoformans biofilms and planktonic cells showed metabolically active (red, FUN-1-stained) cells embedded in the polysaccharide extracellular material (green, ConA stained), while the yellow-brownish areas represent metabolically inactive or nonviable cells. Images were obtained after 24 h of exposure of the fungal cells to various concentrations (4 and 16 μg/ml) of amphotericin B, and the images were compared with those of yeast cells incubated in presence of PBS. The pictures were taken by using a ×40 power field. Scale bars, 50 μm. The results are representative of those of two experiments.
FIG.8.
FIG.8.
C. neoformans biofilms are more resistant to caspofungin than planktonic cells. (A) The percent metabolic activity of C. neoformans strain B3501 biofilms and planktonic cells was measured by the XTT reduction assay. Cells in biofilms and planktonic forms were exposed to various concentrations (0.5, 1, 2, 4, 8, 16, 32, and 64 μg/ml) of caspofungin for 24 h, and their metabolic activities were compared to those of fungal cells incubated in PBS. (B) The percent survival of C. neoformans strain B3501 biofilms and planktonic cells was measured by determination of the numbers of CFU. Both phenotypes were exposed to various concentrations (0.5, 1, 2, 4, 8, 16, 32, and 64 μg/ml) of caspofungin for 24 h, and their rates of survival were compared to those of fungal cells incubated in PBS. For panels A and B, bars are the averages of three measurements, and brackets denote standard deviations. Asterisks denote P value significance, calculated by analysis of variance and adjusted by use of the Bonferroni correction. This experiment was done twice, with similar results each time. (C) CM of C. neoformans B3501 biofilms and planktonic cells treated with caspofungin. Orthogonal images of mature C. neoformans biofilms and planktonic cells showed metabolically active (red, FUN-1-stained) cells embedded in the polysaccharide extracellular material (green, ConA stained), while the yellow-brownish areas represent metabolically inactive or nonviable cells. Images were obtained after 24 h of exposure of fungal cells to various concentrations (4 and 16 μg/ml) of caspofungin, and the images were compared with those of yeast cells incubated in presence of PBS. The pictures were taken by using a ×40 power field. Scale bars, 50 μm. The results are representative of those of two experiments.
FIG.8.
FIG.8.
C. neoformans biofilms are more resistant to caspofungin than planktonic cells. (A) The percent metabolic activity of C. neoformans strain B3501 biofilms and planktonic cells was measured by the XTT reduction assay. Cells in biofilms and planktonic forms were exposed to various concentrations (0.5, 1, 2, 4, 8, 16, 32, and 64 μg/ml) of caspofungin for 24 h, and their metabolic activities were compared to those of fungal cells incubated in PBS. (B) The percent survival of C. neoformans strain B3501 biofilms and planktonic cells was measured by determination of the numbers of CFU. Both phenotypes were exposed to various concentrations (0.5, 1, 2, 4, 8, 16, 32, and 64 μg/ml) of caspofungin for 24 h, and their rates of survival were compared to those of fungal cells incubated in PBS. For panels A and B, bars are the averages of three measurements, and brackets denote standard deviations. Asterisks denote P value significance, calculated by analysis of variance and adjusted by use of the Bonferroni correction. This experiment was done twice, with similar results each time. (C) CM of C. neoformans B3501 biofilms and planktonic cells treated with caspofungin. Orthogonal images of mature C. neoformans biofilms and planktonic cells showed metabolically active (red, FUN-1-stained) cells embedded in the polysaccharide extracellular material (green, ConA stained), while the yellow-brownish areas represent metabolically inactive or nonviable cells. Images were obtained after 24 h of exposure of fungal cells to various concentrations (4 and 16 μg/ml) of caspofungin, and the images were compared with those of yeast cells incubated in presence of PBS. The pictures were taken by using a ×40 power field. Scale bars, 50 μm. The results are representative of those of two experiments.
FIG.9.
FIG.9.
Melanized C. neoformans biofilms were less susceptible to antifungal drugs. (A) Light microscopic image of a melanized C. neoformans strain B3501 biofilm. Arrows denote melanin deposition in the cell wall of cryptococcal cells. Magnification ×400. Scale bar, 20 μm. (B and C) Percent metabolic activity of melanized and nonmelanized C. neoformans strain B3501 biofilms measured by the XTT reduction assay. The cells in biofilms were exposed to various concentrations (0.5, 1, 2, 4, 8, 16, 32, and 64 μg/ml) of amphotericin B (B) or caspofungin (C) for 24 h, and their metabolic activities were compared to those of fungal cells incubated in PBS.
FIG.9.
FIG.9.
Melanized C. neoformans biofilms were less susceptible to antifungal drugs. (A) Light microscopic image of a melanized C. neoformans strain B3501 biofilm. Arrows denote melanin deposition in the cell wall of cryptococcal cells. Magnification ×400. Scale bar, 20 μm. (B and C) Percent metabolic activity of melanized and nonmelanized C. neoformans strain B3501 biofilms measured by the XTT reduction assay. The cells in biofilms were exposed to various concentrations (0.5, 1, 2, 4, 8, 16, 32, and 64 μg/ml) of amphotericin B (B) or caspofungin (C) for 24 h, and their metabolic activities were compared to those of fungal cells incubated in PBS.

Similar articles

Cited by

References

    1. Al-Fattani, M. A., and L. J. Douglas. 2004. Penetration of Candida biofilms by antifungal agents. Antimicrob. Agents Chemother. 48:3291-3297. - PMC - PubMed
    1. Bach, M. C., P. W. Tally, and E. W. Godofsky. 1997. Use of cerebrospinal fluid shunts in patients having acquired immunodeficiency syndrome with cryptococcal meningitis and uncontrollable intracranial hypertension. Neurosurgery 41:1280-1282. - PubMed
    1. Bachmann, S. P., K. VandeWalle, G. Ramage, T. F. Patterson, B. L. Wickes, J. R. Graybill, and J. L. Lopez-Ribot. 2002. In vitro activity of caspofungin against Candida albicans biofilms. Antimicrob. Agents Chemother. 46:3591-3596. - PMC - PubMed
    1. Baillie, G. S., and L. J. Douglas. 1998. Effect of growth rate on resistance of Candida albicans biofilms to antifungal agents. Antimicrob. Agents Chemother. 42:1900-1905. - PMC - PubMed
    1. Baillie, G. S., and L. J. Douglas. 2000. Matrix polymers of Candida biofilms and their possible role in biofilm resistance to antifungal agents. J. Antimicrob. Chemother. 46:397-403. - PubMed

Publication types

MeSH terms

LinkOut - more resources