

Bias in published cost effectiveness studies: systematic review
- PMID: 16495332
- PMCID: PMC1410902
- DOI: 10.1136/bmj.38737.607558.80
Bias in published cost effectiveness studies: systematic review
Abstract
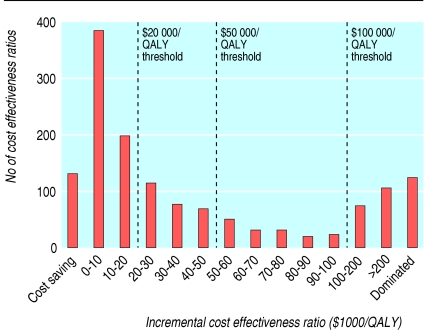
Objective: To investigate if published studies tend to report favourable cost effectiveness ratios (below 20,000 dollars, 50,000 dollars, and 100,000 dollars per quality adjusted life year (QALY) gained) and evaluate study characteristics associated with this phenomenon.
Design: Systematic review. Studies reviewed 494 English language studies measuring health effects in QALYs published up to December 2001 identified using Medline, HealthSTAR, CancerLit, Current Content, and EconLit databases.
Main outcome measures: Incremental cost effectiveness ratios measured in dollars set to the year of publication.
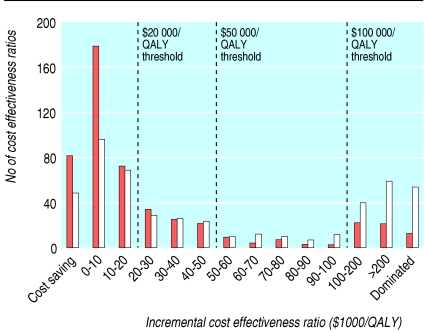
Results: Approximately half the reported incremental cost effectiveness ratios (712 of 1433) were below 20,000 dollars/QALY. Studies funded by industry were more likely to report cost effectiveness ratios below 20,000 dollars/QALY (adjusted odds ratio 2.1, 95% confidence interval 1.3 to 3.3), 50,000 dollars/QALY (3.2, 1.8 to 5.7), and 100,000 dollars/QALY (3.3, 1.6 to 6.8). Studies of higher methodological quality (adjusted odds ratio 0.58, 0.37 to 0.91) and those conducted in Europe (0.59, 0.33 to 1.1) and the United States (0.44, 0.26 to 0.76) rather than elsewhere were less likely to report ratios below 20,000 dollars/QALY.
Conclusion: Most published analyses report favourable incremental cost effectiveness ratios. Studies funded by industry were more likely to report ratios below the three thresholds. Studies of higher methodological quality and those conducted in Europe and the US rather than elsewhere were less likely to report ratios below 20,000 dollars/QALY.
Figures
References
-
- Gold MR, Siegel JE, Russell LB, Weinstein MC. Cost-effectiveness in health and medicine. New York: Oxford University Press, 1996.
-
- Granata AV, Hillman AL. Competing practice guidelines: using cost-effectiveness analysis to make optimal decisions. Ann Intern Med 1998;128: 56-63. - PubMed
-
- Pignone M, Saha S, Hoerger T, Lohr KN, Teutsch S, Mandelblatt J. Challenges in systematic reviews of economic analyses. Ann Intern Med 2005;142: 1073-9. - PubMed
-
- Laupacis A. Incorporating economic evaluations into decision-making: the Ontario experience. Med Care 2005;43(suppl 7): 15-9. - PubMed
-
- Hill SR, Mitchell AS, Henry DA. Problems with the interpretation of pharmacoeconomic analyses: a review of submissions to the Australian pharmaceutical benefits scheme. JAMA 2000;283: 2116-21. - PubMed
Publication types
MeSH terms
Grants and funding
LinkOut - more resources
Full Text Sources