. 2006 May;17(5):2125-37.
doi: 10.1091/mbc.e05-11-1013. Epub 2006 Feb 22.

Functional estrogen receptors in the mitochondria of breast cancer cells

Affiliations

Functional estrogen receptors in the mitochondria of breast cancer cells

Ali Pedram et al. Mol Biol Cell. 2006 May.

Abstract

Steroid hormones have been reported to indirectly impact mitochondrial functions, attributed to nuclear receptor-induced production of proteins that localize in this cytoplasmic organelle. Here we show high-affinity estrogen receptors in the mitochondria of MCF-7 breast cancer cells and endothelial cells, compatible with classical estrogen receptors ERalpha and ERbeta. We report that in MCF-7, estrogen inhibits UV radiation-induced cytochrome C release, the decrease of the mitochondrial membrane potential, and apoptotic cell death. UV stimulated the formation of mitochondrial reactive oxygen species (mROS), and mROS were essential to inducing mitochondrial events of cell death. mROS mediated the UV activation of c-jun N-terminal kinase (JNK), and protein kinase C (PKC) delta, underlying the subsequent translocation of Bax to the mitochondria where oligomerization was promoted. E2 (estradiol) inhibited all these events, directly acting in mitochondria to inhibit mROS by rapidly up-regulating manganese superoxide dismutase activity. We implicate novel functions of ER in the mitochondria of breast cancer that lead to the survival of the tumor cells.


Figures
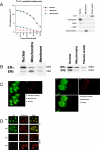
Figure 1.
Figure 1.
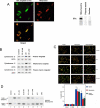
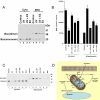
High-affinity ER in mitochondria (A). Left, competition binding of [3H]17β-E2 to nuclear, mitochondrial, and cell membrane fractions of MCF-7 cells. Kds for nuclear, mitochondrial, and cell membrane receptors were 0.283, 0.290, and 0.287 nM, respectively, calculated by Scatchard analysis using the LIGAND computer program. The studies were repeated twice. Right, purity of cell fractions. Immunoblots of membrane protein (5′NT), nuclear proteins (transportin and NTF), Golgi protein (β-COP) and mitochondrial protein (cytochrome C) were carried out in the MCF-7 cell fractions. (B) Western blot of MCF-7 (left) or bovine aortic EC (right) cell fractions. Cell lysate was immunoprecipitated with specific antibodies to the ERα and ERβ isoforms, normalized for protein, and proteins were separated by gel electrophoresis, transferred, and then immunoblotted. Molecular weight markers are shown. (C) Immunofluorescence confocal microscopy of ERα (left) and ERβ (right) in MCF-7. The cells were cultured on coverslips and then incubated for 20 min with Mitotracker dye (red; Molecular Probes). After washing, the cells were fixed and permeabilized and then incubated with antibody to either ER isoform, followed by second antibody conjugated to FITC (green color). Overlap is seen in yellow. (D) Lack of mitochondrial ER in ERα/ERβ deleted cells. EC were isolated from the capillaries of mice bred for combined ERα and ERβ deletion (DERKO). Confocal microscopy fails to show any ER in any cell compartment in EC from DERKO mice, whereas EC from wild-type mice show receptors for each ER isoform in various cell locations.
Figure 2.
Figure 2.
Mitochondrial effects of E2. (A) Left, cells were treated with brief UV exposure (50 J/s) and abundance of cytochrome C was determined in MCF-7 cell fractions by Western blot for up to 240 min. The study was repeated. Right, E2 prevents UV-induced cytochrome C release into the cytosol at 60 min. MCF-7 were briefly exposed to UV in the presence or absence of E2, and steroid was continued for 60 min. (B) A predominantly mitochondrial distribution of cytochrome c (control) changed to a largely diffuse cytosolic pattern in response to UV, prevented by E2. MCF-7 were briefly exposed to UV, with or without 10 nM E2, or E2+ICI182780 (1 μM; ER antagonist) for 60 min. After fixing and permeabilizing the cells, incubation with the first antibody to cytochrome C was followed by second antibody conjugated to FITC. The study was repeated. (C) MCF-7 were briefly exposed to UV, the cells incubated with or without E2 or ICI182780 for 4 h, and then loss of membrane potential was determined using the Apo-Alert kit (Clontech) as described in Materials and Methods. Decreased mitochondrial membrane potential was seen as a color change from predominantly red to green. As controls, cells were also exposed to ICI or E2 alone without significant effect (unpublished data).
Figure 3.
Figure 3.
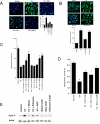
E domain of ERα mediates E2 effects at the mitochondria. (A) Left, expression of the mitochondrial-targeted E domain of ERα. CHO cells were transfected to express the E domain of ERα (green) targeted to the mitochondria, using a targeting vector containing a mitochondrial localization sequence (Clontech). Mitotracker dye indicates the mitochondria (red). The merged panel shows virtually complete colocalization of ER with Mitotracker dye (orange-yellow). Right, Western blot of ERα E domain targeted to the mitochondria and expressed in HCC-1569 cells. Western blot of cell fractions was accomplished with an antibody to the ERα ligand-binding domain (H222). (B) The E domain of ERα was targeted to the plasma membrane, mitochondria, or nucleus in HCC-1569 cells. Western blot of cytochrome C in cytoplasm at 60 min post-UV in the presence or absence of 10 nM E2 treatment is shown. The study is representative of two experiments. (C) Mitochondrial membrane potential and apoptosis in E domain-targeted HCC-1569 cells. Cells were briefly exposed to UV, then ±E2, or E2 alone, and membrane potential/apoptosis was determined at 4 h. Control cells were transfected but sham exposed to UV. The bar graph represents the mean plus SEM from three combined studies, 200 cells counted per condition in each. *p < 0.05 for control or E2 alone versus UV, +p < 0.05 for UV+E2 versus UV by ANOVA plus Schefe's test. (D) ERα and ERβ mediate E2 action at the mitochondria. Isolated mitochondria from MCF-7 cells were exposed to UV ± 10 nM of E2, PPT, or DPN, and cytochrome C release into the incubation medium or in the mitochondrial pellet was determined by Western blot at 60 min. The representative study was repeated twice additionally.
Figure 4.
Figure 4.
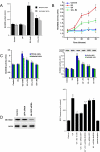
Reactive oxygen species (ROS) underlies cell fate decisions. (A) MCF-7 cells were exposed to UV ± antioxidants NAC (N-acetylcystine) 5 mM, rotenone 2.5 μM, or Mito-Q 10 μM. ROS production was determined 4 h after UV exposure by confocal microscopy using the fluorescent indicator, CM-H2DCFDA, and quantified by spectroflourometry. The bar graph represents three studies combined. *p <0.05 for control versus UV, +p < 0.05 for UV versus UV plus antioxidant. None of the antioxidant compounds had significant effects on ROS formation by themselves (unpublished data). (B) Estradiol/ER prevents UV-induced ROS formation. The cells were exposed to brief UV, with or without E2 or 1 μM ICI182780, and incubated for 4 h. The bar graph is data from three combined experiments. *p < 0.05 for control versus UV, +p < 0.05 for UV versus UV+E2, ++p < 0.05 for UV+E2 versus same plus ICI182780. (C) MCF-7 were exposed to UV ± 0.1–10 nM 17-β-E2, 10 nM 17-α-E2, 10 nM progesterone (P) or testosterone (T), or 10 nM PPT or DPN. Steroid compounds were continued for the length of the experiment. Cell viability was determined by the MTT assay at 4 h. Decreased viability is shown by a loss of spectral absorbance to the dye. Data are from three experiments; *p < 0.05 for control versus UV, +p < 0.05 for UV versus UV plus steroid. (D) MCF-7 were exposed to UV ± antioxidants and cell viability was determined by the MTT assay at 4 h. Data are from three experiments; *p < 0.05 for control versus UV, +p < 0.05 for UV versus UV plus antioxidant. (E) Inhibitors of ROS generation reverse UV-induced cytochrome C release into the cytoplasm. A representative study shown here was repeated. Actin serves as loading control.
Figure 5.
Figure 5.
Estrogen upregulates MnSOD activity to inhibit ROS. (A) Isolated mitochondria or whole MCF-7 cells were exposed to UV ± E2, or E2 alone for 4 h, and MnSOD activity was determined using a kit (Cayman). Control is sham UV-irradiated cells. The data are from three combined experiments, *p < 0.05 for control versus E2, +p < 0.05 for E2 versus E2 + UV. (B) Time course of MnSOD activity. MCF-7 cells were exposed to UV ± E2 and activity from discrete wells of cells was determined every 10 min for 1 h. Each data point is the mean of quintuplicate replicates, the study repeated a second time. (C) ER mediates E2 stimulation of MnSOD activity. MCF-7 cells or isolated mitochondria were exposed to brief UV and then incubated with 10 nM E2 in the presence or absence of 1 μM ICI182780, for 20 min (left) or 4 h (right). The bar graphs represent three experiments combined. *p < 0.05 for control versus E2, +p < 0.05 for E2 versus same + either UV or ICI182780. Also shown is an immunoblot of MnSOD protein over 4 h in isolated mitochondria. (D) Left, validation of siRNA knockdown of MnSOD protein. Western blot for MnSOD or actin occurred 48 h after transfection of MCF-7 cells with either siRNA to MnSOD or GFP (control). Right, MCF-7 were transfected and recovered and then exposed to UV ± 10 nM E2. ROS were measured 4 h later and the data are from three combined experiments. *p < 0.05 for control versus UV, +p < 0.05 for UV versus UV + E2, ++p < 0.05 for UV + E2 versus same plus siRNA to MnSOD.
Figure 6.
Figure 6.
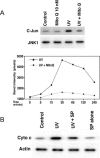
Role of JNK in UV-induced cell death. (A) MCF-7 cells were exposed to UV in the presence of absence of Mito-Q, and JNK activity was determined sequentially over a 4-h period. The top panel shows the 30 min time point. A representative study is shown, repeated once. (B) Cells were briefly exposed to UV ± SP 600125, a JNK-1 inhibitor, the latter continued for 4 h. Cytochrome C in the cytoplasm was determined by Western blot, and the study was repeated.
Figure 7.
Figure 7.
PKC isoforms and cell fate. (A) Whole MCF-7 cells were exposed to brief UV ± E2, and then PKCδ activity was determined with phospho-specific antibody to tyrosine 311 (activation site) at 30 min and 4 h, during the presence or absence of sex steroid. PKCε activity (serine 729 phosphorylation) was similarly determined. The study was repeated a second time, while specific PKC proteins were determined using separate antibodies to the PKC isoforms. (B) Cells were exposed to UV in the presence or absence of Mito Q and PKCδ activity was determined. A representative experiment of three and total PKCδ protein is shown is shown. (C) PKC isoform activity. MCF-7 were incubated with 10 nM E2 in the absence or presence of UV exposure, the cells were lysed, and PKC δ or ε protein was immunoprecipitated and then utilized for an in vitro activity assay using appropriate substrate. Data are from a single study, repeated once. Total PKC protein is shown as a loading control. (D) MCF-7 were transfected with 2.5 μg of siRNA to either PKCβ, δ, or ε, and Western blotting for PKCδ (left) and PKCε (right) occurred 48 h later. (E) Cells were transfected to express the various siRNAs, and experiments occurred 48 h later. Left, transfected and recovered cells were exposed to UV, and cytochrome C in cytoplasm was determined 4 h later. Right, cells were exposed to UV ± E2 in the presence/absence of siRNAs, and cytochrome C was determined. Actin protein is expressed both as a specificity control for the effects of PKC knockdown and as a protein loading control. The studies were repeated a second time.
Figure 8.
Figure 8.
Bax translocation to mitochondria (A) MCF-7 cells were exposed to UV ± E2. Bax localization and structure in cytosol and mitochondrial fractions were determined by Western blot using a specific antibody that detects BAX dimerization. The study was repeated two additional times. (B) MCF-7 cells were exposed to brief UV ± Mito-Q, NAC, or Rotenone for 4 h. Bax localization was then determined. The studies were repeated three times and the band intensity data were combined for the bar graph. *p < 0.05 for control versus UV, +p < 0.05 for UV versus same + antioxidant. (C) MCF-7 were exposed to UV ± 10 μM SP 600125 (JNK 1 inhibitor), or 5 μM Rottlerin (PKCδ inhibitor). The representative study was repeated. (D) Cartoon of estrogen action at mitochondria to prevent apoptosis.

References

    1. Aslan, M., and Ozben, T. (2003). Oxidants in receptor tyrosine kinase signal transduction pathways. Antioxid. Redox. Signal 5, 781–788. - PubMed
    1. Benhar, M., Engelberg, D., and Levitzki, A. (2002). ROS, stress-activated kinases and stress signaling in cancer. EMBO Rep. 3, 420–425. - PMC - PubMed
    1. Borras, C., Sastre, J., Garcia-Sala, D., Lloret, A., Pallardo, F. V., and Vina, J. (2003). Mitochondria from females exhibit higher antioxidant gene expression and lower oxidative damage than males. Free Radic. Biol. Med. 34, 546–552. - PubMed
    1. Borras, C., Gambini, J., Gomez-Cabrera, M. C., Sastre, J., Pallardo, F. V., Mann,G. E., and Vina, J. (2005).. 17beta-oestradiol up-regulates longevity-related, antioxidant enzyme expression via the ERK1 and ERK2[MAPK]/NFkappaB cascade. Aging Cell 4, 113–118. - PubMed
    1. Brodie, C., and Blumberg, P. M. (2003). Regulation of cell apoptosis by protein kinase c delta. Apoptosis 8, 19–27. - PubMed

Publication types

MeSH terms