. 2006 Jun;95(6):3449-59.
doi: 10.1152/jn.00823.2005. Epub 2006 Feb 22.

Serotonergic modulation of inspiratory hypoglossal motoneurons in decerebrate dogs

Affiliations

Serotonergic modulation of inspiratory hypoglossal motoneurons in decerebrate dogs

Ivo F Brandes et al. J Neurophysiol. 2006 Jun.

Abstract

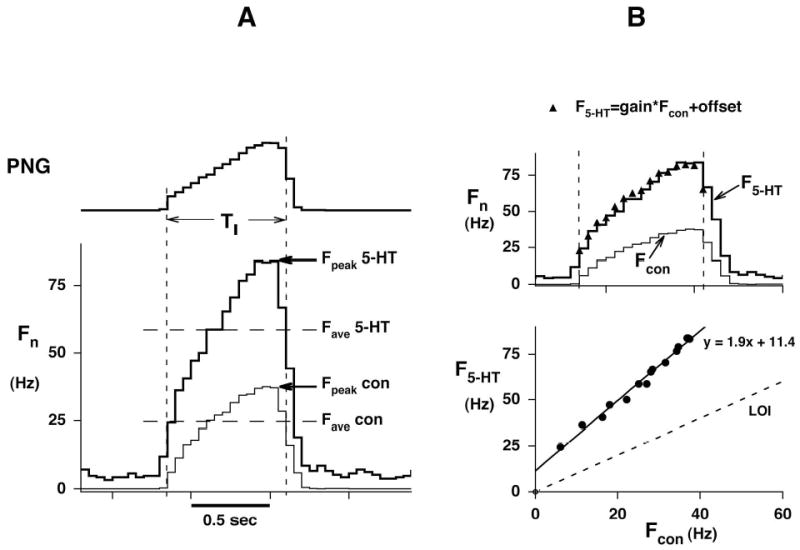
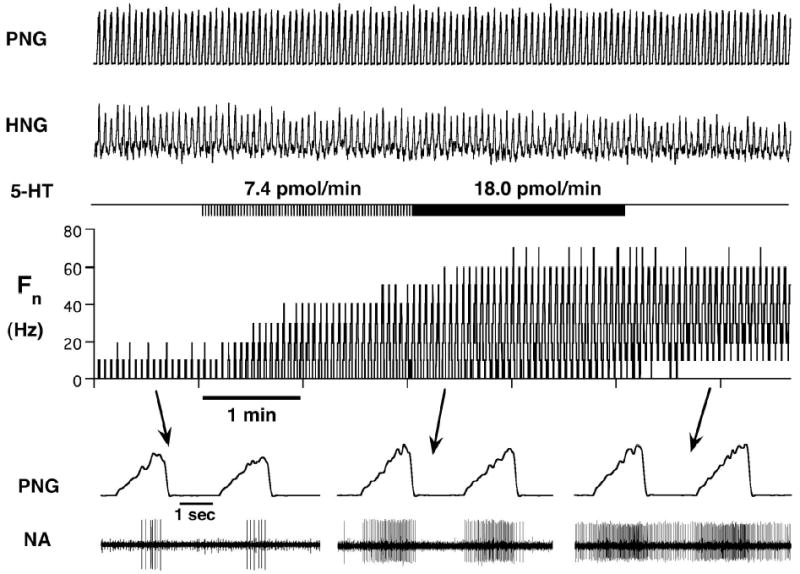
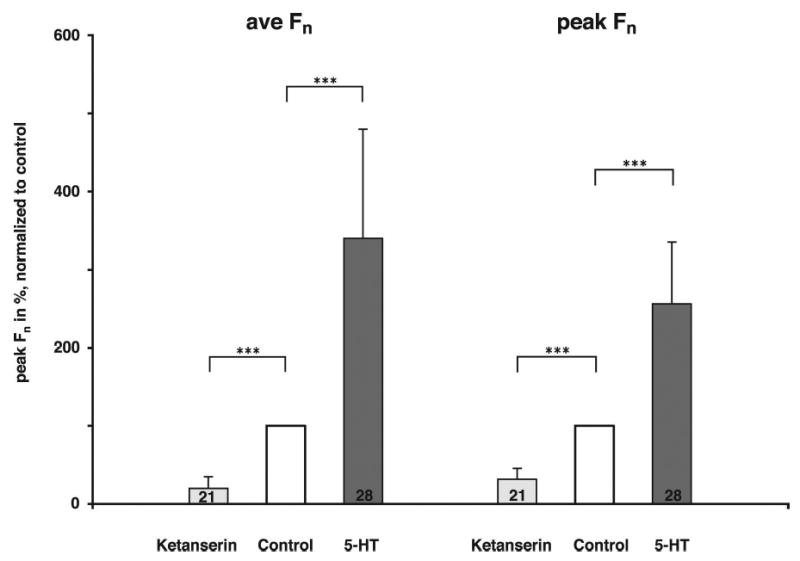
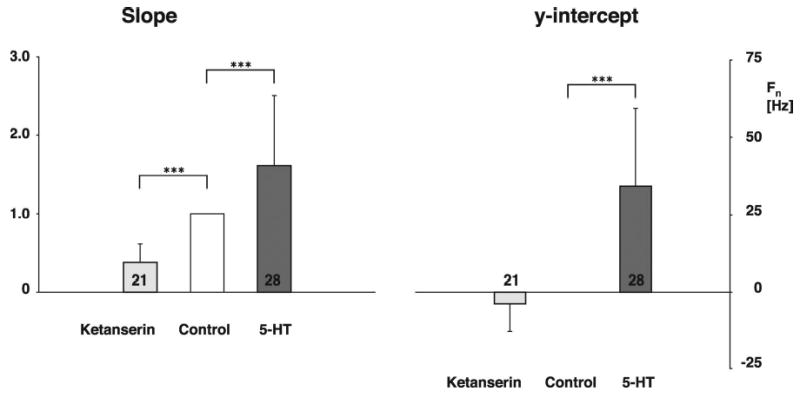
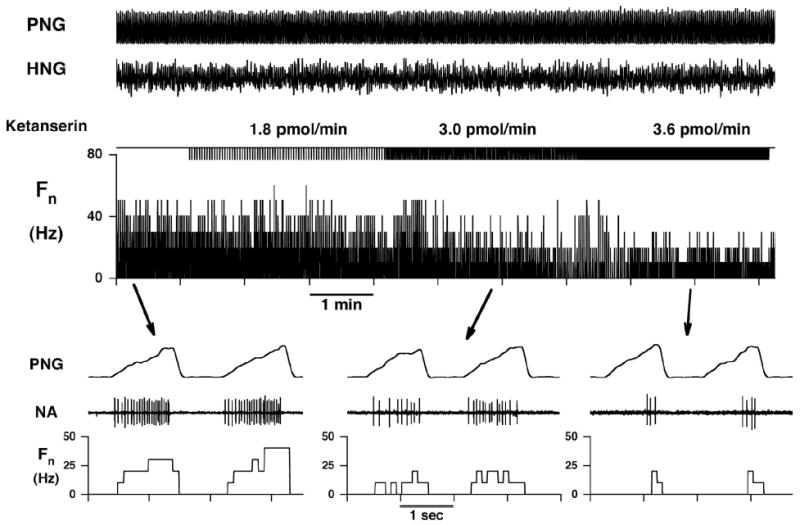
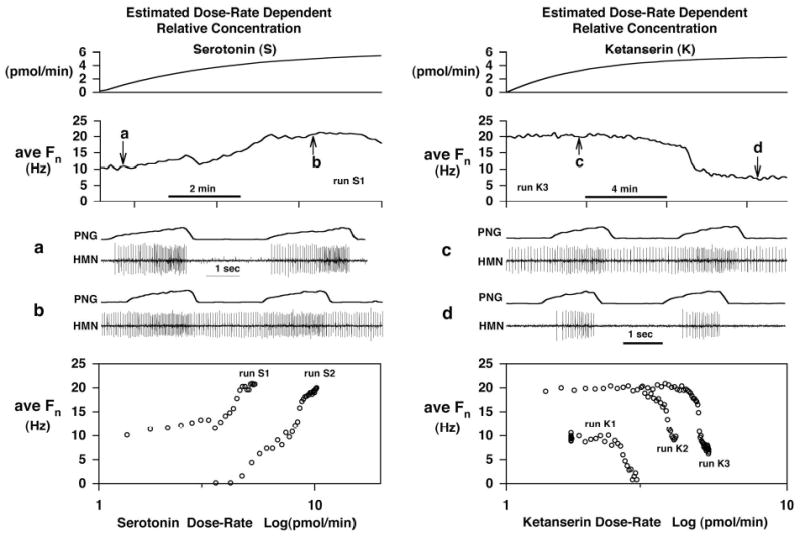
Inspiratory hypoglossal motoneurons (IHMNs) maintain upper airway patency. However, this may be compromised during sleep and by sedatives, potent analgesics, and volatile anesthetics by either depression of excitatory or enhancement of inhibitory inputs. In vitro data suggest that serotonin (5-HT), through the 5-HT2A receptor subtype, plays a key role in controlling the excitability of IHMNs. We hypothesized that in vivo 5-HT modulates IHMNs activity through the 5-HT2A receptor subtype. To test this hypothesis, we used multibarrel micropipettes for extracellular single neuron recording and pressure picoejection of 5-HT or ketanserin, a selective 5-HT2A receptor subtype antagonist, onto single IHMNs in decerebrate, vagotomized, paralyzed, and mechanically ventilated dogs. Drug-induced changes in neuronal discharge frequency (F(n)) and neuronal discharge pattern were analyzed using cycle-triggered histograms. 5-HT increased the control peak F(n) to 256% and the time-averaged F(n) to 340%. 5-HT increased the gain of the discharge pattern by 61% and the offset by 34 Hz. Ketanserin reduced the control peak F(n) by 68%, the time-averaged F(n) by 80%, and the gain by 63%. These results confirm our hypothesis that in vivo 5-HT is a potent modulator of IHMN activity through the 5-HT2A receptor subtype. Application of exogenous 5-HT shows that this mechanism is not saturated during hypercapnic hyperoxia. The two different mechanisms, gain modulation and offset change, indicate that 5-HT affects the excitability as well as the excitation of IHMNs in vivo.


Figures

Figure 1
Figure 1
The presence of an axon spike potential in the spike-triggered average of hypoglossal (XII) nerve activity, delayed relative to a hypoglossal motoneuron (HMN) action potential confirmed that the recorded brainstem neuron was a HMN (500 sweeps/average).
Figure 2
Figure 2
Analysis of neuronal data using Cycle-Triggered Histograms (CTHs) A: Peak (Fpeak) and time-averaged (Fave) neuronal discharge frequency before (Fcon) or during 5-HT ejection (F5-HT). Each graph represents the averaged values of 10–15 respiratory cycles (50 msec bins). PNG: Phrenic neurogram, TI: inspiratory duration (vertical dashed lines), Fn:neuronal discharge frequency. B, Upper: Analysis period (vertical dotted lines) of the cycle-triggered histograms. B, Lower: Plot of F5-HT vs. Fcon shows that the two discharge patterns are linearly related. F5-HT = slope * Fcon + y-intercept where the slope (1.90) is the gain and the y-intercept (11.4 Hz) is the offset of the pattern. LOI: Line of identity. Recalculating F5-HT values from Fcon with help of the linear regression parameters yields values that closely match the original CTH (superimposed triangles in B, upper).
Figure 3
Figure 3
Response of an inspiratory hypoglossal motoneuron to increasing dose rates of 5-HT. The duration of picoejection is shown (5-HT) and the dose rates are given. The bottom traces show time-expanded views during control conditions and at different 5-HT dose rates. The simultaneously recorded phrenic neurogram identifies this neuron as inspiratory and the positive spike-triggered average (not shown) verifies that this is a HMN. At the intermediate dose rate, the neuron fires throughout the whole inspiratory phase, while at the maximal effective dose rate the neuron also shows activity during the previously silent expiratory phase. PNG: phrenic neurogram, HNG: hypoglossal neurogram, Fn: rate meter of neuronal discharge frequency in Hz, NA: neuronal activity.
Figure 4
Figure 4
Comparison of the effect of 5-HT and ketanserin on time-averaged Fn and peak Fn; values are given as mean and SD. The numbers in the bars indicate the number of protocols in each group. At maximally effective dose rates 5-HT increased the time-averaged Fn to 340 % (SD 140) and the peak Fn to 256 % (SD 79); whereas, ketanserin decreased the time-averaged Fn by 80 % (SD 15) and the peak Fn by 68 % (SD 15). ***: p < 0.001.
Figure 5
Figure 5
Effect of 5-HT and ketanserin on the slope and the y-intercept of the relationship between the neuronal discharge patterns for the control and maximal effective drug dose rates. 5-HT increased the slope of the neuronal discharge pattern by 61 % (SD 89); whereas, ketanserin caused a decrease of 63 % (SD 24). 5-HT shifted the y-intercept by 34 Hz (SD 26) and ketanserin reduced the y-intercept by 4 Hz (SD 9). Values are given as mean and SD. Numbers in the bars indicate the number of protocols per group. ***: p < 0.001.
Figure 6
Figure 6
Response of an inspiratory hypoglossal motoneuron to increasing dose rates of ketanserin. The duration of picoejection is marked (ketanserin) and the dose rates are given. The bottom traces show time-expanded views. The simultaneously recorded phrenic neurogram identifies this neuron as inspiratory. PNG: phrenic neurogram, HNG: hypoglossal neurogram, Fn: rate meter of neuronal discharge frequency in Hz, NA: neuronal activity.
Figure 7
Figure 7
Competitive antagonism between serotonin (S) and the serotonin antagonist ketanserin (K). An inspiratory hypoglossal motoneuron was sequentially exposed to S and K to show that K competitively blocks serotonergic activation of the neuron. The left and right panels show agonist and antagonist data, respectively. From top to bottom the estimated relative drug concentration, the average Fn /respiratory-cycle duration, two time-expanded views of the neuron activity, and finally plots of average Fn vs. log of the relative concentration are shown. The estimated relative concentrations are related to the dose rate, where continuous picoejection at a constant rate is initiated at time zero. Due to diffusion properties, the relative concentration (CR) increases asymptotically, i.e., CR = dose rate *[1-exp(-t/180 sec)], to a level that is proportional to the picoejection dose rate. The agonist and antagonist were applied in the following sequence S1→K1→S2→S2&K2→S2&K3. Numbers indicate run number. The bottom graphs demonstrate competitive antagonism between S and K. Picoejection of S increased ave Fn (S1; 6.1 pmol/min). After recovery from S, K antagonism resulted in silencing of the neuronal activity (K1; 3.4 pmol/min)). During the K block, significantly higher S rates (10.8 pmol/min) were required to overcome the competitive K antagonism as demonstrated by the right shift of the S2 curve. Once S reversed the K block, the peak S dose rate was maintained and an increased K rate (4.5 pmol/min) resulted in competitive antagonism (K2), which was overcome by an increase in the ongoing S rate (15.3 pmol/min) once the K2 run was terminated. A further parallel shift in antagonist dose rate (K3; 5.4 pmol/min) occurred during the ongoing S2 dose rate (15.3 pmol/min).
Figure 8
Figure 8
CO2 responses of phrenic nerve and XII nerve activities in hyperoxic decerebrate dogs. Upper: Example of the effects of CO2, measured as end-tidal ETCO2 (mmHg), on the moving-time averages of phrenic nerve activity (PNG, top trace) and XII nerve activity (XII, 2nd trace). Lower Left: plot of normalized peak activity vs. ETCO2 associated with the example from the upper traces. Nonlinear regression was used to fit both nerve activity plots and to aid in extrapolating the apneic thresholds. A hyperbolic function of the form: Y=(X-φ)3/[(X-φ)3+(Xo-φ)3)] was used, where Y is peak activity, X is ETCO2, φ is ETCO2-axis intercept and Xo is the ETCO2 level for 50% of maximum peak activity. The response curve for XII activity is shifted to the right and shallower with a greater linear range compared to the phrenic activity. The apneic thresholds are ~38 and ~42 mmHg for the phrenic and XII activities, respectively. An ETCO2 of ~52 mmHg produced a peak XII activity of 50% of maximum. Lower center: XII nerve activity vs. ETCO2 plots for five dogs (thin lines) and group mean curve (thick line). In three of five animals there was no XII activity below an ETCO2 of 42 mmHg. Lower right: mean curves ± 1 SE bands of both activities. The XII nerve activity curve was consistently right shifted and shallower than the phrenic response curve. ETCO2 levels of 65–70 mmHg were required to produce maximal XII activity. ETCO2 levels required for 50% of maximum ranged from 41–55 mmHg (center plots).

Similar articles

Cited by

References

    1. Aldes LD, Chapman ME, Chronister RB, Haycock JW. Sources of noradrenergic afferents to the hypoglossal nucleus in the rat. Brain Res Bull. 1992;29:931–942. - PubMed
    1. Anderson JW, Sant'Ambrogio FB, Orani GP, Sant'Ambrogio G, Mathew OP. Carbon dioxide-responsive laryngeal receptors in the dog. Respir Physiol. 1990;82:217–226. - PubMed
    1. Bayliss DA, Viana F, Talley EM, Berger AJ. Neuromodulation of hypoglossal motoneurons: cellular and developmental mechanisms. Respir Physiol. 1997;110:139–150. - PubMed
    1. Berger AJ, Bayliss DA, Viana F. Modulation of neonatal rat hypoglossal motoneuron excitability by serotonin. Neurosci Lett. 1992;143:164–168. - PubMed
    1. Brandes IF, Dean C, Jakovcevic D, Stucke AG, Hopp FA, Zuperku EJ, Stuth EA. Anatomical location of genioglossus motoneurons within the adult canine hypoglossal motor nucleus. FASEB J. 2004a;D 561:468.7.

Publication types

LinkOut - more resources