. 2006 Feb 22;26(8):2313-20.
doi: 10.1523/JNEUROSCI.4425-05.2006.

The kinetics of synaptic vesicle reacidification at hippocampal nerve terminals

Affiliations

The kinetics of synaptic vesicle reacidification at hippocampal nerve terminals

Pradeep P Atluri et al. J Neurosci. .

Abstract

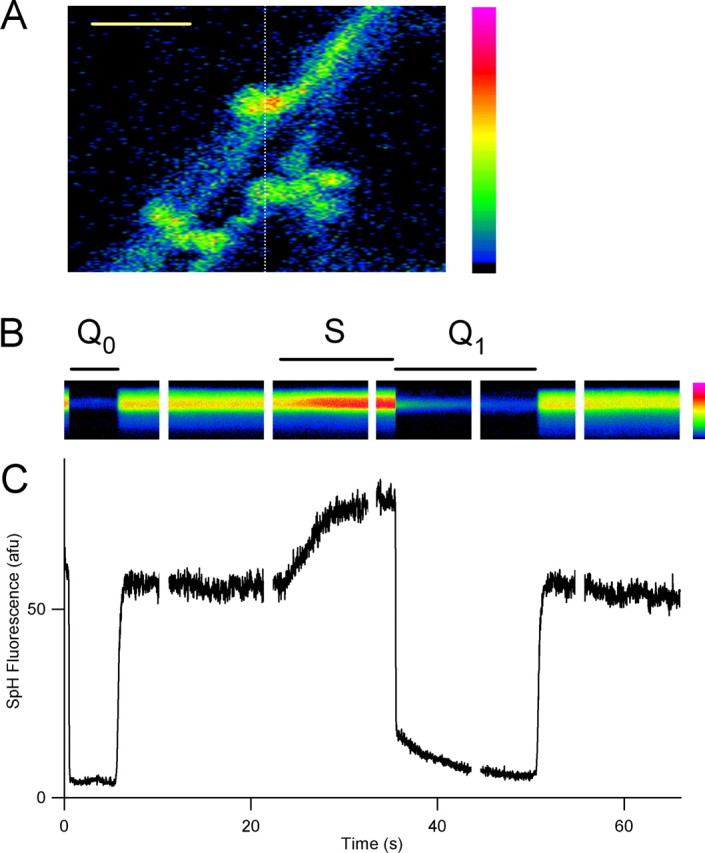
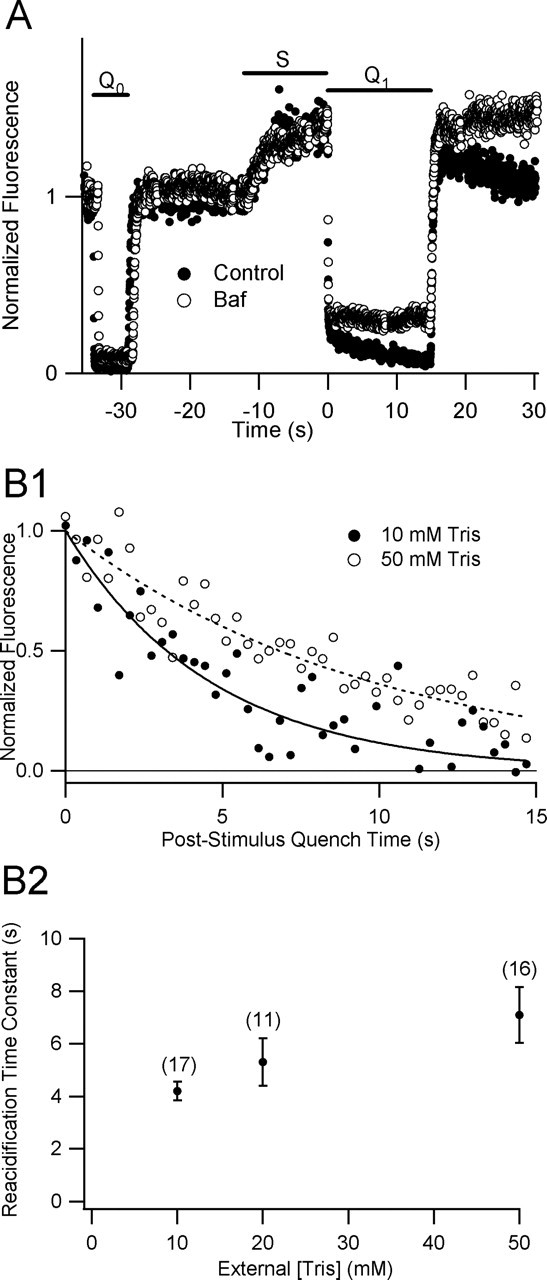
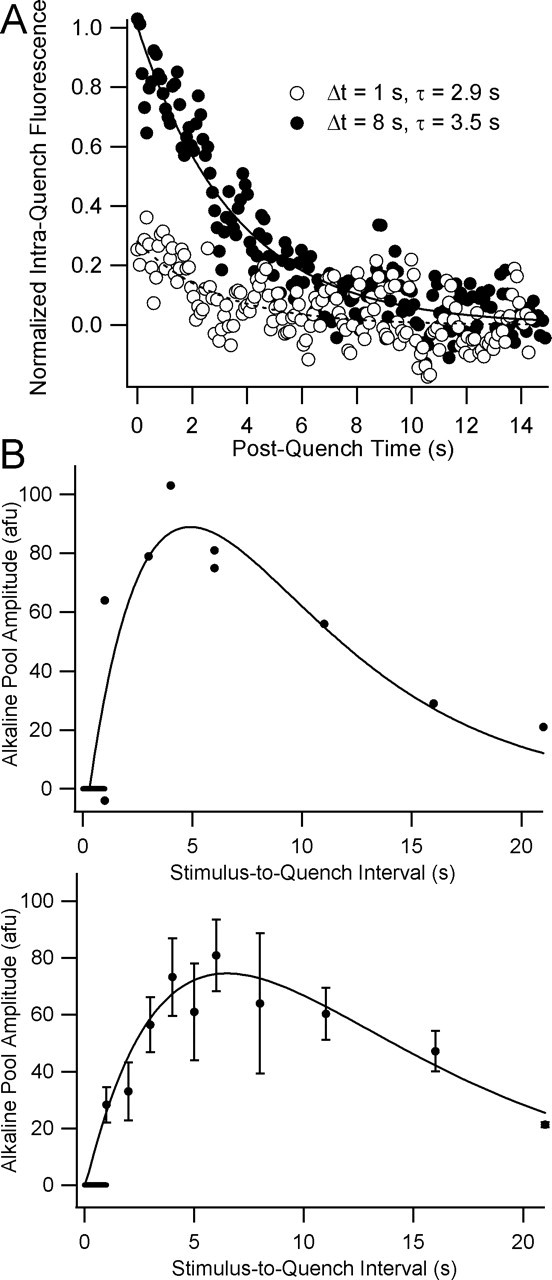
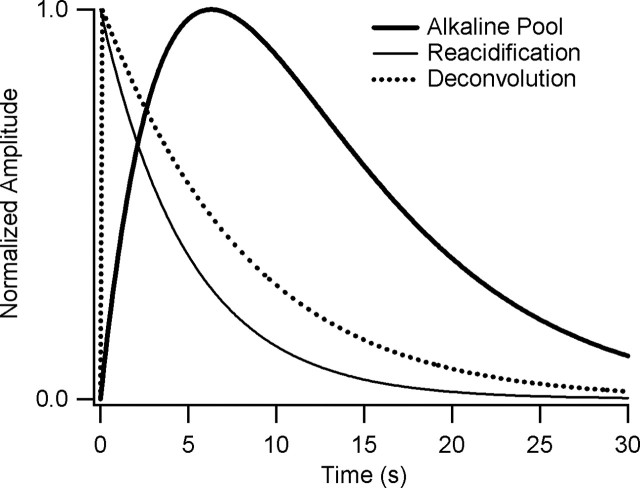
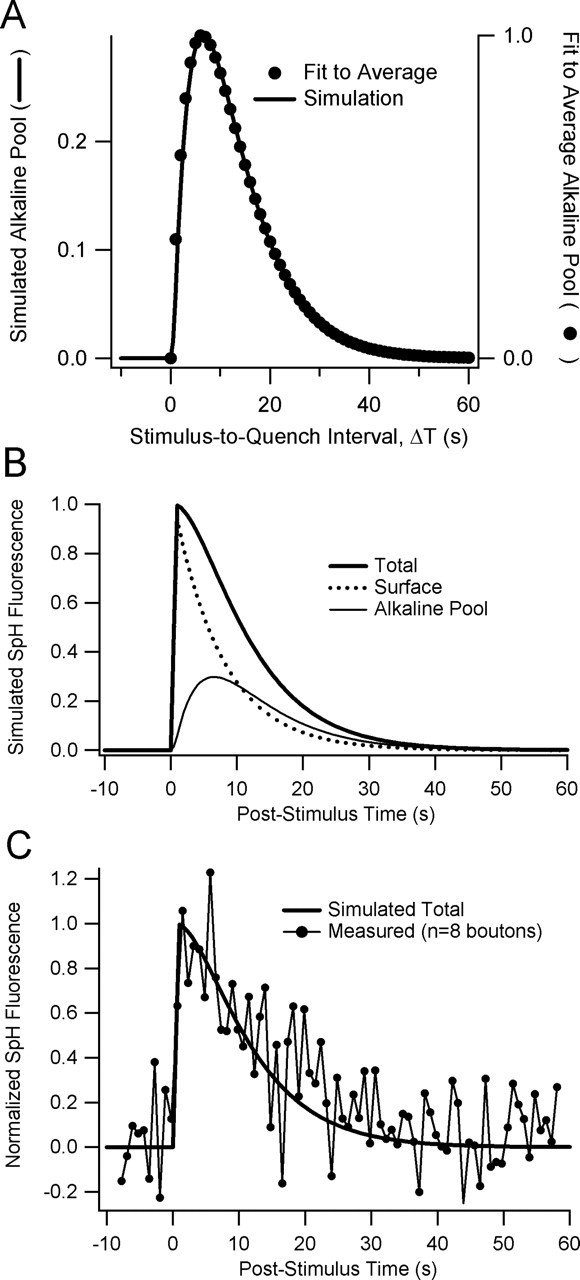
After exocytosis, synaptic vesicles are recycled locally in the synaptic terminal and are refilled with neurotransmitter via vesicular transporters. The biophysical mechanisms of refilling are poorly understood, but it is clear that the generation of a proton gradient across the vesicle membrane is crucial. To better understand the determinants of vesicle refilling, we developed a novel method to measure unambiguously the kinetics of synaptic vesicle reacidification at individual synaptic terminals. Hippocampal neurons transfected with synapto-pHluorin (SpH), a synaptic vesicle-targeted lumenal GFP (green fluorescent protein), whose fluorescence is quenched when protonated (pKa approximately 7.1), were rapidly surface-quenched immediately after trains of repetitive electrical stimulation. The recently endocytosed alkaline pool of SpH is protected from such surface quenching, and its fluorescence decay reflects reacidification kinetics. These measurements indicate that, after compensatory endocytosis, synaptic vesicles reacidify with first-order kinetics (tau approximately 4-5 s) and that their rate of reacidification is subject to slowing by increased external buffer.


Figures

Figure 1.
Figure 1.
Rapid acid quench of surface SpH fluorescence allows measurement of internal alkaline vesicle pool and postendocytic reacidification time course. A, Confocal image of resting fluorescence of axons and presynaptic terminals transfected with synapto-pHluorin, with a dashed line at the position of the scan line for B. Scale bar, 3.4 μm. B, Line-scan time series of fluorescence from a single bouton, with rapid surface quenching by pulsed-pressure application of impermeant acid (45 mm MES, pH 5.25) before (Q0, 5 s duration) and immediately after (Q1, 15 s) field electrical stimulation (S; 12 s, 20 Hz). A, B, Pseudocolor scale bars (right) are linear, with black indicating zero fluorescence. C, Plot of fluorescence time course, computed by averaging those rows from B with stimulus-evoked fluorescence increase. Time scale is the same as that in B.
Figure 2.
Figure 2.
A, SpH fluorescence decay during poststimulus acid quench is blocked by a specific inhibitor of V-ATPase. SpH fluorescence sampled every 21 ms from a presynaptic bouton in control solution (closed circles) and after 30 s treatment with 1 μm Baf (open circles). Pressure-pulse application of impermeant acid before (Q0, 5 s) and immediately after (Q1, 15 s) a stimulus train (S, 12 s, 20 Hz) reveals a stimulation-dependent quench-resistant fluorescence transient whose decay is blocked by inhibition of the V-ATPase. Similar results were observed in a series of 13 paired trials on 8 separate preparations using a stimulus of 30 s at 10 Hz and a sampling interval of 342 ms. B, Sensitivity of reacidification kinetics to extracellular proton buffer. B1, Two fluorescence transients from the poststimulus quench periods of successive trials at the same bouton, normalized to unitary amplitude B2, Summary plot of reacidification time constants (mean ± SEM) versus external [Tris]. Parentheses indicate number of trials for each point. All Tris experiments were performed in 91 mm NaCl (see Materials and Methods) with stimulus trains of 30 s at 10 Hz. Unpaired two-tailed Student’s t tests indicate a statistically significant difference (p < 0.013) between mean time constants in 10 and 50 mm Tris but no significant difference between 10 and 20 mm Tris (p > 0.19) or between 20 and 50 mm Tris (p > 0.23).
Figure 3.
Figure 3.
Time course of alkaline pool growth and decay after a 1 s, 40 Hz train. A, Normalized fluorescence transients measured during 15 s quenches begun 1 s and 8 s after stimulus onset. The alkaline pool amplitude at time Δt is estimated by taking the difference of the means of the first five and the last five points of the quench period. Sampling interval for these experiments is 85.4 ms. B, Plots of alkaline pool amplitudes from a representative experiment (top) and from seven such experiments (bottom; mean ± SEM) versus the interval between stimulus and quench onsets. Curves are fits to an α function of the following form: y = k*(Δt − delay)*exp(−(Δt − delay)/τ), where k is a scaling factor, and Δt is the stimulus–quench interval, and delay is a time offset term. The fit parameters {k, delay, τ} (± SD) were {53 ± 16, 0.3 ± 0.5 s, 4.6 ± 1.0 s} for the curve in the top panel and {31 ± 6, 0.1 ± 0.4 s, 6.4 ± 1.0 s} for the curve in the bottom panel (see Materials and Methods). Horizontal bars at origins indicate the stimulus period.
Figure 4.
Figure 4.
Deconvolution of reacidification time course (thin solid line) from alkaline pool dynamics (thick solid line) gives the estimated time course of endocytosis (dotted line) after a 1 s, 40 Hz train. Each curve was normalized to its peak value.
Figure 5.
Figure 5.
Simple simulation of alkaline pool dynamics. A, Superposition of average alkaline pool time course (closed circles) and simulated alkaline pool time course (solid line). Numerical simulation used a zero-order rate constant of 1 s−1 for exocytosis and first-order rate constants of 0.135 and 0.2 s−1 for endocytosis and reacidification, respectively. B, Time courses of surface (dotted line) and alkaline pool (thin solid line) SpH fluorescence; their sum is the expected SpH fluorescence transient (thick solid line) with no surface quenching. The time course of reacidification significantly influences the time course of SpH fluorescence transient after brief trains. C, The simulated SpH curve (smooth line) from (B) with superimposed data from an experiment with 1 s, 40 Hz stimulation and field scanning of eight boutons with sampling interval ∼700 ms. Error bars were omitted for clarity.

References

    1. Aravanis AM, Pyle JL, Tsien RW (2003). Single synaptic vesicles fusing transiently and successively without loss of identity. Nature 423:643–647. - PubMed
    1. Fernandez-Alfonso T, Ryan TA (2004). The kinetics of synaptic vesicle pool depletion at CNS synaptic terminals. Neuron 41:943–953. - PubMed
    1. Fremeau RT Jr, Voglmaier S, Seal RP, Edwards RH (2004). VGLUTs define subsets of excitatory neurons and suggest novel roles for glutamate. Trends Neurosci 27:98–103. - PubMed
    1. Gandhi SP, Stevens CF (2003). Three modes of synaptic vesicular recycling revealed by single-vesicle imaging. Nature 423:607–613. - PubMed
    1. Grabe M, Oster G (2001). Regulation of organelle acidity. J Gen Physiol 117:329–344. - PMC - PubMed

Publication types