. 2006 Feb 22;26(8):2343-57.
doi: 10.1523/JNEUROSCI.5247-05.2006.

Transsynaptic signaling by postsynaptic synapse-associated protein 97

Affiliations

Transsynaptic signaling by postsynaptic synapse-associated protein 97

Maria Paz Regalado et al. J Neurosci. .

Abstract

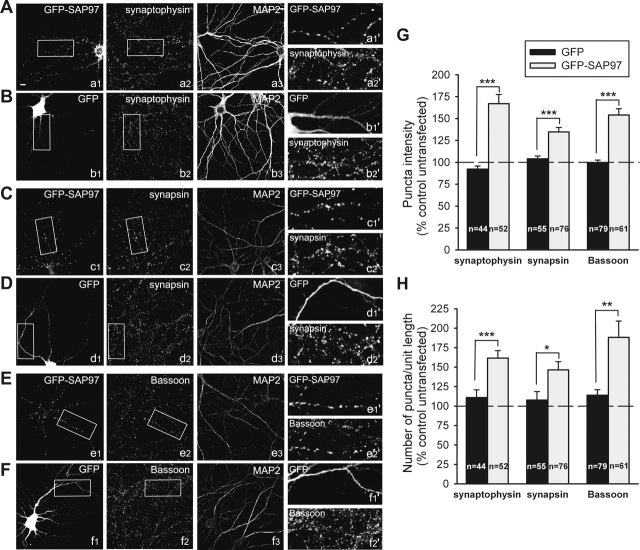
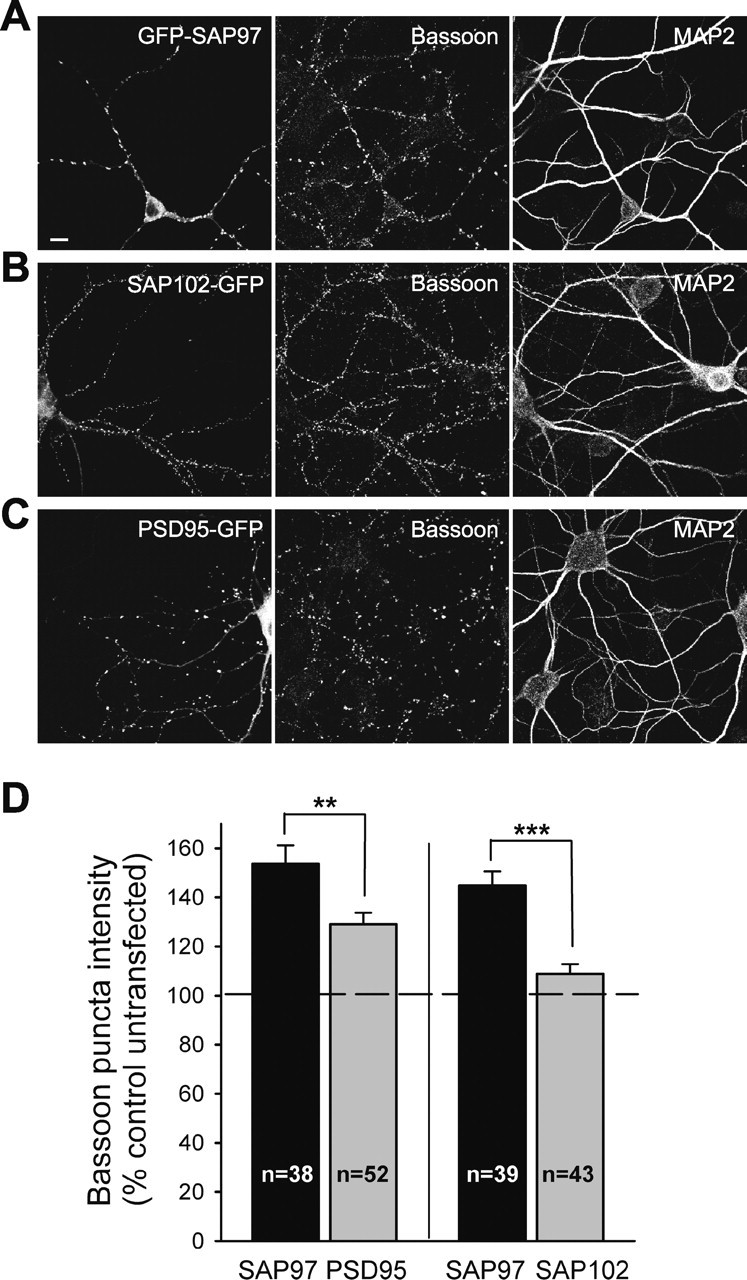
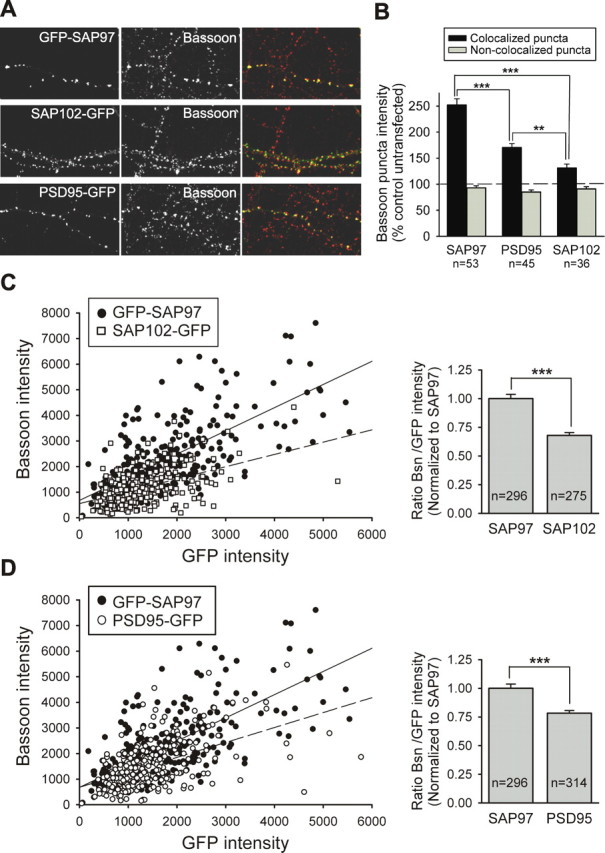
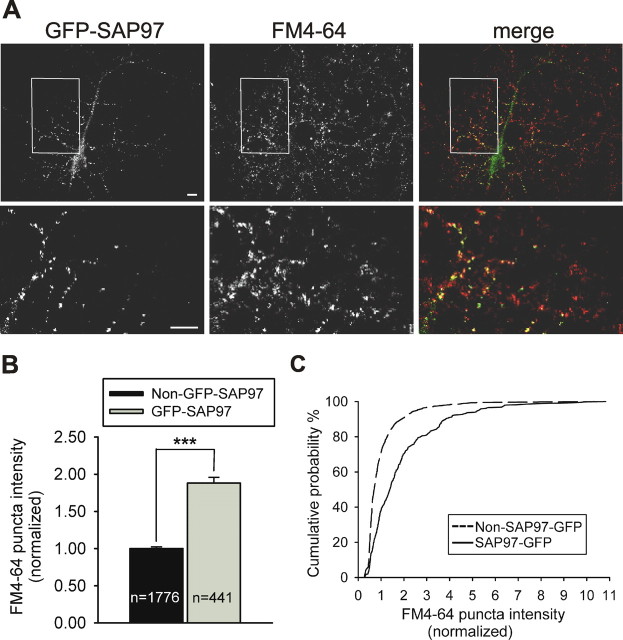
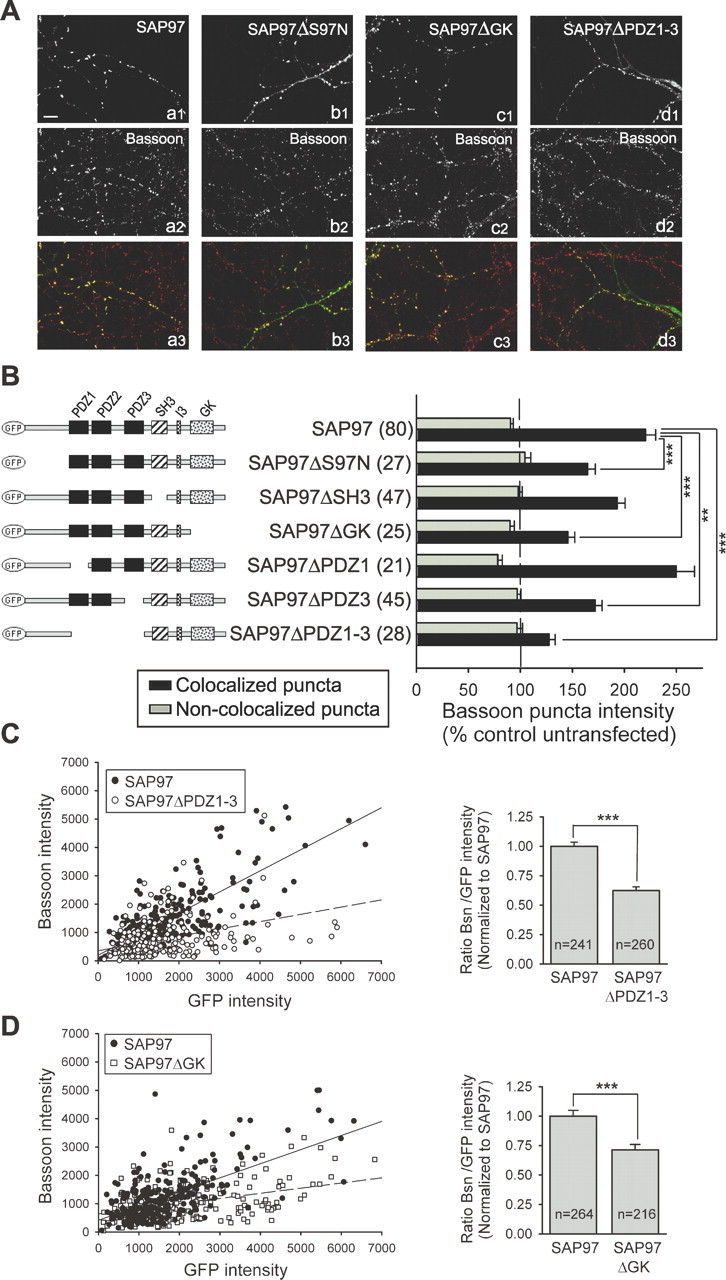
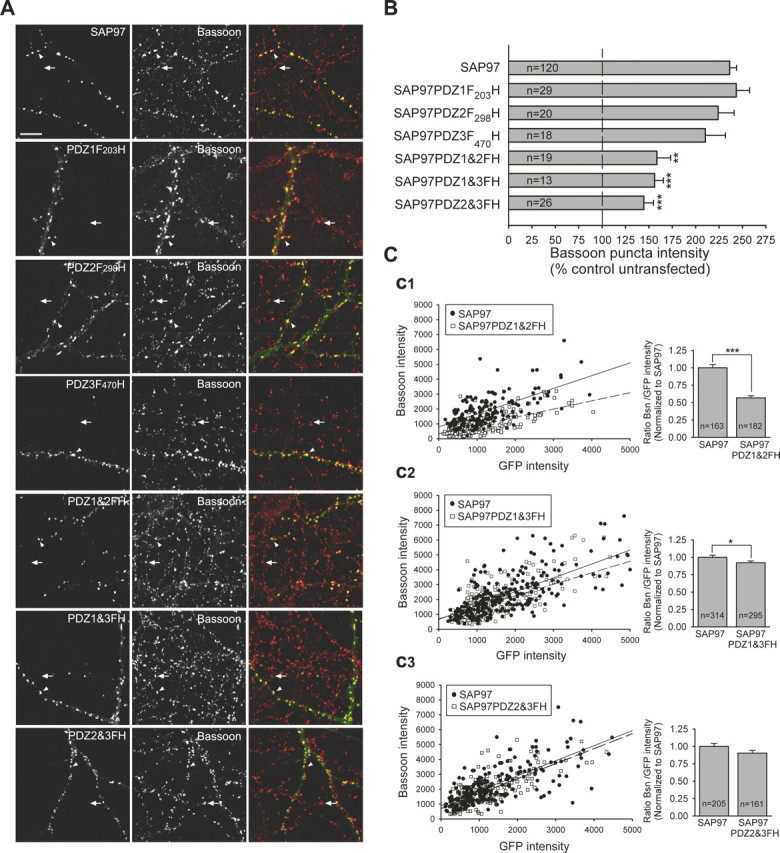
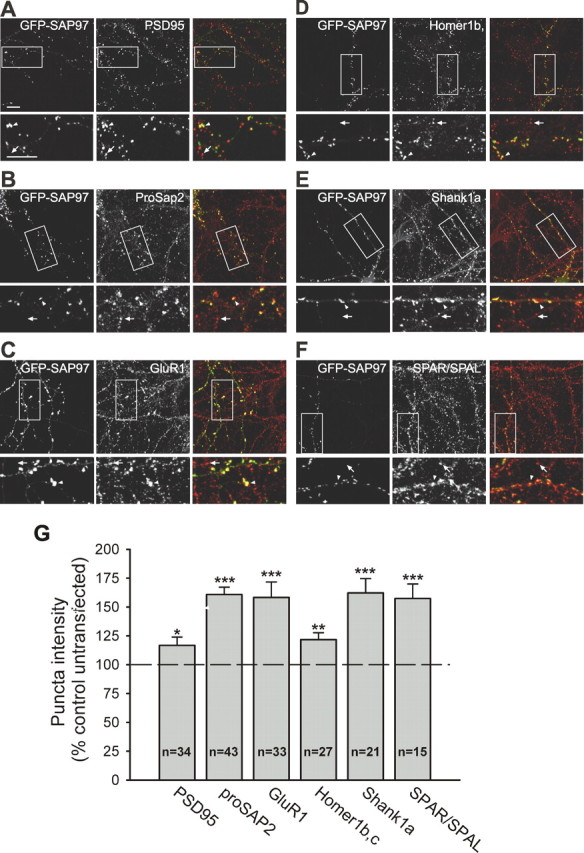
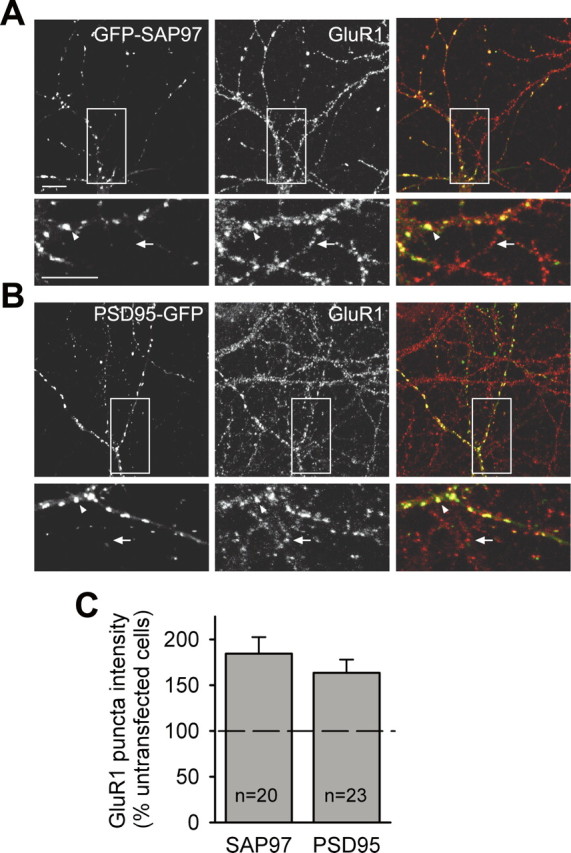
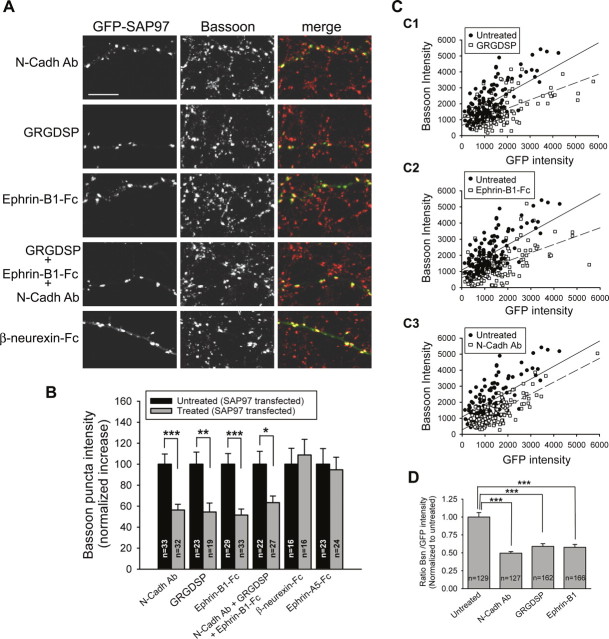
The molecular mechanisms by which postsynaptic modifications lead to precisely coordinated changes in presynaptic structure and function are primarily unknown. To address this issue, we examined the presynaptic consequences of postsynaptic expression of members of the membrane-associated guanylate kinase family of synaptic scaffolding proteins. Postsynaptic expression of synapse-associated protein 97 (SAP97) increased presynaptic protein content and active zone size to a greater extent than comparable amounts of postsynaptic PSD-95 (postsynaptic density-95) or SAP102. In addition, postsynaptic expression of SAP97 enhanced presynaptic function, as measured by increased FM4-64 dye uptake. The structural presynaptic effects of postsynaptic SAP97 required ligand binding through two of its PDZ (PSD-95/Discs large/zona occludens-1) domains as well as intact N-terminal and guanylate kinase domains. Expression of SAP97 recruited a complex of additional postsynaptic proteins to synapses including glutamate receptor 1, Shank1a, SPAR (spine-associated RapGAP), and proSAP2. Furthermore, inhibition of several different transsynaptic signaling proteins including cadherins, integrins, and EphB receptor/ephrinB significantly reduced the presynaptic growth caused by postsynaptic SAP97. These results suggest that SAP97 may play a central role in the coordinated growth of synapses during development and plasticity by recruiting a complex of postsynaptic proteins that enhances presynaptic terminal growth and function via multiple transsynaptic molecular interactions.


Figures

Figure 1.
Figure 1.
Postsynaptic expression of SAP97 enhances expression of presynaptic proteins. A–F, Representative images of hippocampal neurons transfected with GFP–SAP97 (a1, c1, e1) or GFP (b1, d1, f1) and double stained for synaptophysin (a2, b2), synapsin (c2, d2), or Bassoon (e2, f2) and MAP2 (a3–f3) to visualize the dendrites. Individual channels are shown in grayscale for better resolution. Enlargements of the boxed regions are shown in the respective right panels (a1′–f2′). Scale bar: (in a1) 10 μm. G, Quantitative analysis of changes in the average puncta intensity of the indicated presynaptic protein induced by overexpression of GFP–SAP97 (gray bars) or GFP (black bars). Bars show mean ± SEM expressed as percentage of average puncta intensity in neighboring untransfected neurons in the same microscopic field (n = number of cells). ***p < 0.0005 (two-tailed t test). H, Quantitative analysis of changes in the number of puncta per unit length of the indicated presynaptic protein in the same neurons as in G. ***p < 0.0005, **p < 0.005, *p < 0.05; two-tailed t test.
Figure 2.
Figure 2.
SAP97 has larger presynaptic effect than PSD-95 and SAP102. A–C, Representative images of hippocampal neurons transfected with GFP–SAP97 (A), SAP102–GFP (B), or PSD-95–GFP (C) and double stained for Bassoon (middle) and MAP2 (right). Individual channels are shown in grayscale for better resolution. Scale bar: (in A) 10 μm. D, Quantification of the effects of GFP–SAP97 and PSD-95–GFP (left part) or GFP–SAP97 and SAP102–GFP (right) on average Bassoon puncta intensity (mean ± SEM). Comparisons were made between transfected neurons from sister cultures (n = number of cells). ***p < 0.0005, **p < 0.005; two-tailed t test.
Figure 3.
Figure 3.
Differences in the presynaptic effects of SAP97, PSD-95, and SAP102 are not attributable to differences in their synaptic targeting. A, Representative images of neurons transfected with GFP–SAP97, SAP102–GFP, or PSD-95–GFP as indicated. GFP fluorescence is shown in the left panels, Bassoon staining is shown in the middle panels, and merged images are shown in the right panels. B, Quantification of the average Bassoon puncta intensity induced by overexpression of GFP–SAP97, SAP102–GFP, or PSD-95–GFP. The black bars show the average intensity of Bassoon puncta that colocalize with GFP-tagged proteins in a single dendrite, and the gray bars show the average intensity of Bassoon puncta that do not colocalize in the same dendrite (mean ± SEM; n = number of cells). ***p < 0.0005, **p < 0.005; one-way ANOVA test and a Tamhane post test. C, Left, Intensities of individual Bassoon (Bsn) puncta are plotted as a function of the corresponding colocalized GFP–SAP97 or SAP102–GFP puncta intensities (4 transfected cells each). Linear regression is shown as a solid line for GFP–SAP97 and a dashed line for SAP102–GFP. Right, Comparison of Bassoon/GFP intensity ratio for individual puncta expressing GFP–SAP97 or SAP102–GFP. Comparisons were made between transfected neurons from sister cultures. Data were normalized to Bsn/GFP–SAP97 ratio (mean ± SEM; n = number of puncta; same data as in left panel). ***p < 0.0005; two-tailed t test. D, Same as C except data from PSD-95–GFP-transfected cells (n = 5) are plotted.
Figure 4.
Figure 4.
Postsynaptic SAP97 expression enhances presynaptic function. A, Representative image of FM4-64 staining of functional presynaptic terminals on neurons transfected with GFP–SAP97. GFP fluorescence is shown in the left panels, FM4-64 fluorescence is shown in the middle panels, and merged images are shown in the right panels. Individual channels are shown in grayscale for better resolution. The bottom panels are higher-magnification images of the boxed regions in the top panels. Scale bars, 10 μm. B, Quantitative analysis of changes in average FM4-64 puncta intensity comparing puncta colocalized with GFP–SAP97 (gray bar) versus non-colocalized, control puncta (black bar) on the same coverslips. Bars show mean ± SEM normalized to the average control puncta intensity (n = number of puncta; ***p < 0.0005, two-tailed t test). C, Cumulative probability distribution of FM4-64 puncta intensities (same data as in B).
Figure 5.
Figure 5.
Specific structural domains of SAP97 are required for its presynaptic effects. A, Representative images of neurons transfected with GFP–SAP97 (a1), GFP–SAP97ΔS97N (b1), GFP–SAP97ΔGK (c1), and GFP–SAP97ΔPDZ1–3 (d1). Each neuron was double stained for Bassoon (a2–d2) and MAP2 (not shown). Merged images are shown in a3–d3. Scale bar: (in a1) 10 μm. B, Left, Schematic diagrams of SAP97 constructs used in this study. Different structural domains are indicated. Right, Quantification of changes in Bassoon puncta intensity induced by the different SAP97 constructs. The black bars show the average intensity of Bassoon puncta that colocalize with the GFP–SAP97 puncta in a single dendrite, and the gray bars show the average intensity of puncta that do not colocalize in the same dendrite (mean ± SEM; numbers in parentheses indicate number of cells examined). Neurons expressing GFP–SAP97ΔS97N, GFP–SAP97ΔGK, GFP–SAP97ΔPDZ3, or GFP–SAP97ΔPDZ1–3 showed a significant decrease in the average Bassoon puncta intensity when compared with neurons overexpressing wild-type GFP–SAP97 (***p < 0.0005, **p < 0.005; one-way ANOVA test and a Tamhane post test). C, Left, Intensities of individual Bassoon puncta are plotted as a function of the corresponding colocalized GFP–SAP97 or GFP–SAP97ΔPDZ1–3 puncta intensities (9 transfected cells each). Linear regression is shown as a solid line for GFP–SAP97 and a dashed line for SAP97ΔPDZ1–3. Right, Comparison of Bassoon (Bsn)/GFP intensity ratio for individual puncta expressing GFP–SAP97 or SAP97ΔPDZ1–3. Comparisons were made between transfected neurons from sister cultures. Data were normalized to the Bsn/GFP-SAP97 ratio (mean ± SEM; n = number of puncta; same data as in left panel). ***p < 0.0005, two-tailed t test. D, Same as C, except data from GFP–SAP97- and GFP–SAP97ΔGK-transfected cells (5 and 7 cells, respectively) are plotted.
Figure 6.
Figure 6.
SAP97 PDZ1 and PDZ2 ligand-binding pockets are critical for its presynaptic effects. A, Representative images of neurons transfected with GFP–SAP97 or GFP–SAP97 PDZ domain mutants, as indicated in the left panels. Each row of images shows GFP fluorescence (left), Bassoon labeling (middle), and merged images (right). Staining for MAP2 is not shown. The arrowheads indicate Bassoon puncta on transfected neurons. The arrows indicate Bassoon puncta on untransfected neighboring neurons. Scale bar, 10 μm. Mutants are point mutants for the ligand-binding pocket of the individual PDZ1 (PDZ1F203H), PDZ2 (PDZ2F298H), and PDZ3 (PDZ3F470H) domains and the three possible combinations of two mutant PDZ domains (PDZ1&2FH, PDZ1&3FH, and PDZ2&3FH). B, Quantification of the average Bassoon puncta intensity that colocalized with puncta of the GFP-tagged SAP97 mutants (mean ± SEM; n = number of cells; ***p < 0.0005, **p < 0.005, one-way ANOVA test and a Tamhane post test). Neurons expressing any of the double PDZ domain point mutants, PDZ1&2FH, PDZ1&3FH, and PDZ2&3FH, showed a significant decrease in the average Bassoon puncta intensity when compared with neurons expressing wild-type GFP–SAP97. C, Left, Intensities of individual Bassoon puncta are plotted as a function of the corresponding colocalized GFP–SAP97 or GFP–SAP97PDZ1&2FH (C1), GFP–SAP97PDZ1&3FH (C2), and GFP–SAP97PDZ2&3FH (C3) (n = 3 or 4 transfected cells each). Linear regression is shown as solid lines for GFP–SAP97 and dashed lines for the mutant GFP–SAP97s. Right, Comparison of Bassoon (Bsn)/GFP intensity ratio for individual puncta expressing GFP–SAP97 or the PDZ mutants. Comparisons were made between transfected neurons from sister cultures. Data were normalized to the Bsn/GFP–SAP97 ratio (mean ± SEM; n = number of puncta; same data as in left panels; ***p < 0.0005, *p < 0.05, two-tailed t test).
Figure 7.
Figure 7.
SAP97 recruits additional postsynaptic proteins. A–F, Representative images of neurons transfected with GFP–SAP97 and stained for PSD-95 (A), ProSAP2 (B), GluR1 (C), Homer1b,c (D), Shank1a (E), and SPAR/SPAL (F). The left panels show GFP fluorescence, the middle panels show the immunostained protein, and the right panels show merged images. The bottom panels are higher-magnification images of the boxed regions in the top panels. Scale bars: (in A) 10 μm). The arrowheads indicate puncta colocalized with GFP–SAP97 on transfected cells; the arrows indicate puncta on untransfected neighboring neurons. G, Quantification of the average puncta intensity of the indicated endogenous proteins in neurons expressing GFP–SAP97. The histograms show mean ± SEM expressed as percentage of average puncta intensity in neighboring untransfected neurons in the same field (n = number of cells; ***p < 0.0005, **p < 0.005, *p < 0.05, two-tailed t test).
Figure 8.
Figure 8.
SAP97 and PSD-95 both enhance surface expression of AMPA receptors. A, B, Representative images of neurons transfected with GFP–SAP97 (A) or PSD-95–GFP (B) and immunostained for surface GluR1. The left panels show GFP fluorescence, the middle panels show GluR1 surface staining, and the right panels show merged images. The bottom panels are higher-magnification images of the boxed regions in the top panels. Scale bars: (in A) 10 μm. The arrowheads indicate GluR1 puncta colocalized with GFP–SAP97 in transfected neurons; the arrows indicate GluR1 puncta on untransfected neighboring neurons. C, Quantification of the effect of GFP–SAP97 and PSD-95–GFP expression on the average surface GluR1 puncta intensity. The histograms show mean ± SEM expressed as percentage of average puncta intensity in neighboring untransfected neurons in the same field (n = number of cells).
Figure 9.
Figure 9.
Inhibition of transsynaptic interactions of N-cadherins, integrins, or EphB receptor/ephrinB1 decreases the presynaptic effects of postsynaptic SAP97. A, Representative images of neurons transfected with GFP–SAP97 and treated for 3 d with different reagents, as indicated on the left. Each row of images shows GFP fluorescence (left), staining for Bassoon (middle), and merged images (right). Scale bar, 10 μm. B, Quantification of the average Bassoon puncta intensity in neurons expressing SAP97–GFP in treated and untreated sister cultures. The black bars show the normalized average increase of Bassoon puncta intensity that colocalize with GFP–SAP97 from control, untreated cultures. The gray bars show the average increase of Bassoon puncta intensity that colocalize with GFP–SAP97 in treated cultures. The increase was normalized to that observed in sister control cultures so the magnitude of the inhibitory effects of the reagents could be quantitatively assessed. Treatment with soluble unclustered β-neurexin-Fc or Ephrin-A5-Fc failed to prevent the SAP97-mediated increase in Bassoon staining compared with untreated sister cultures. Treatment with a function blocking antibody for N-cadherin (N-Cadh Ab), a peptide that inhibits integrin interactions (GRGDSP), soluble unclustered Ephrin-B1-Fc, or a combination of these three reagents significantly decreased the presynaptic effects of SAP97 (mean ± SEM; n = number of cells; ***p < 0.0005, **p < 0.005, *p < 0.05, two-tailed t test). C, Intensities of individual Bassoon puncta are plotted as a function of the corresponding colocalized GFP–SAP97 for untreated cultures and cultures treated with the integrin inhibitory peptide (C1), Ephrin-B1-Fc (C2), or N-Cadh Ab (C3) (n = 3 transfected cells for each condition). Linear regression is shown as solid lines for untreated cultures and dashed lines for treated cultures. D, Comparison of Bassoon (Bsn)/GFP intensity ratio for individual puncta expressing GFP–SAP97 in untreated and treated cultures. Comparisons were made between transfected neurons from sister cultures. Data were normalized to the Bsn/GFP–SAP97 ratio in untreated cultures (mean ± SEM; n = number of puncta; same data as in C). ***p < 0.0005, two-tailed t test.

Similar articles

Cited by

References

    1. Belichenko PV, Masliah E, Kleschevnikov AM, Villar AJ, Epstein CJ, Salehi A, Mobley WC (2004). Synaptic structural abnormalities in the Ts65Dn mouse model of Down syndrome. J Comp Neurol 480:281–298. - PubMed
    1. Betz WJ, Bewick GS (1992). Optical analysis of synaptic vesicle recycling at the frog neuromuscular junction. Science 255:200–203. - PubMed
    1. Boeckers TM, Winter C, Smalla KH, Kreutz MR, Bockmann J, Seidenbecher C, Garner CC, Gundelfinger ED (1999). Proline-rich synapse-associated proteins ProSAP1 and ProSAP2 interact with synaptic proteins of the SAPAP/GKAP family. Biochem Biophys Res Commun 264:247–252. - PubMed
    1. Boeckers TM, Bockmann J, Kreutz MR, Gundelfinger ED (2002). ProSAP/Shank proteins–a family of higher order organizing molecules of the postsynaptic density with an emerging role in human neurological disease. J Neurochem 81:903–910. - PubMed
    1. Cai C, Coleman SK, Niemi K, Keinanen K (2002). Selective binding of synapse-associated protein 97 to GluR-A alpha-amino-5-hydroxy-3-methyl-4-isoxazole propionate receptor subunit is determined by a novel sequence motif. J Biol Chem 277:31484–31490. - PubMed

Publication types

Substances